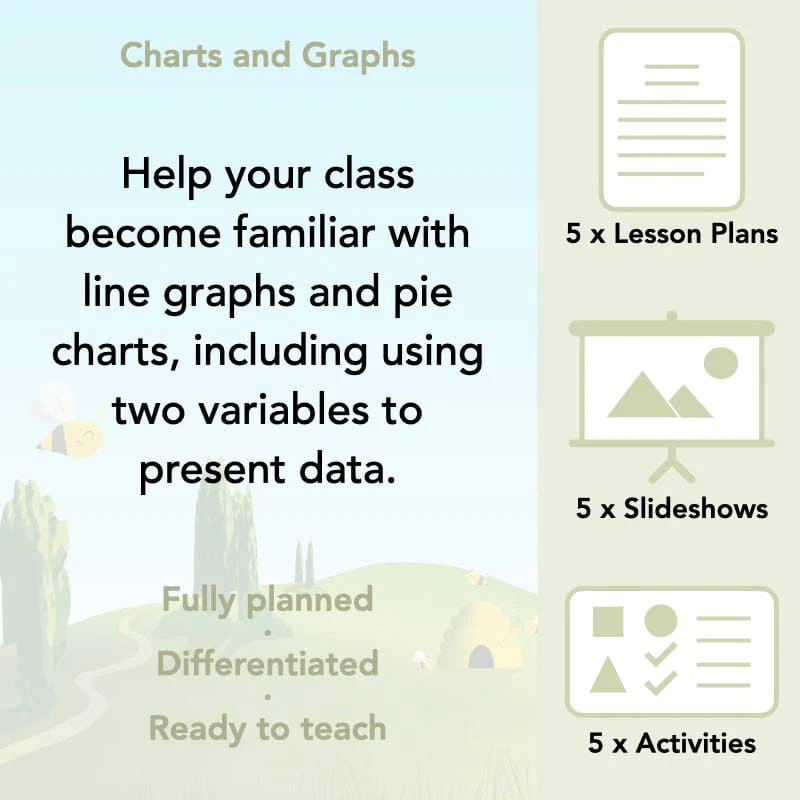
Charts and Graphs
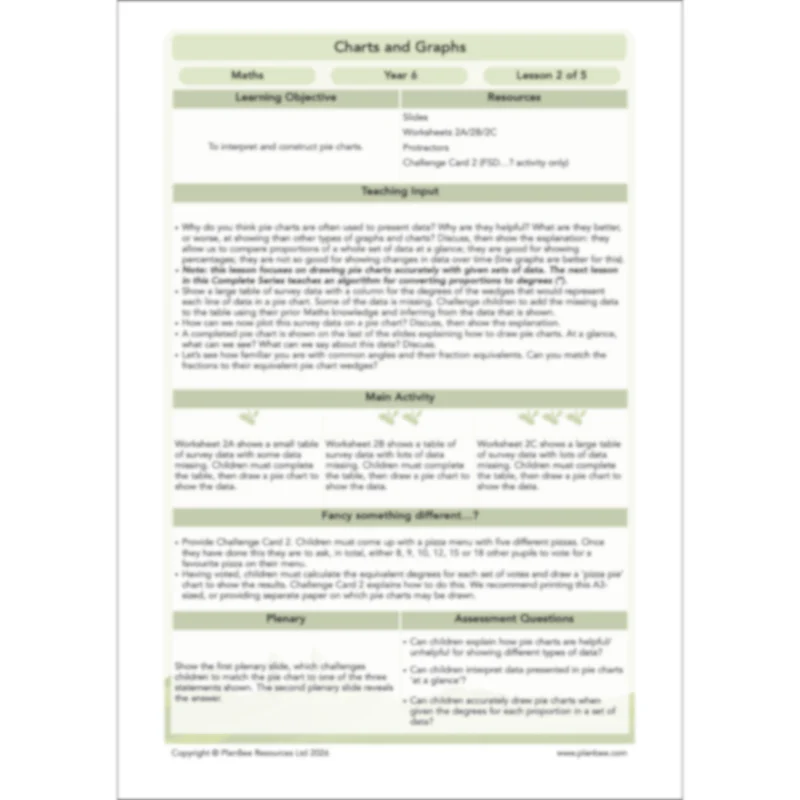
Revisit, and build upon, the skills required to read and interpret line graphs and pie charts. Building on those skills, teach children to produce detailed, accurate and meaningful line graphs with two variables.
Three of the five lessons included with this Complete Series focus on a particularly tricky skill: converting proportions of a set of data into proportions of 360 degrees, then plotting the data accurately using pie charts. The included presentations each build upon the learning from the last, giving children the opportunity to build up their skills a little at a time.
Finally, there’s a choice of opportunities for children to demonstrate and apply their learning either by producing fun, fact-filled infographics or completing a charts and graphs quiz; either way, you’ll have all you need to accurately assess their learning!
This downloadable set of lessons includes detailed planning, engaging slideshow presentations and printable teaching resources.
Two Variables
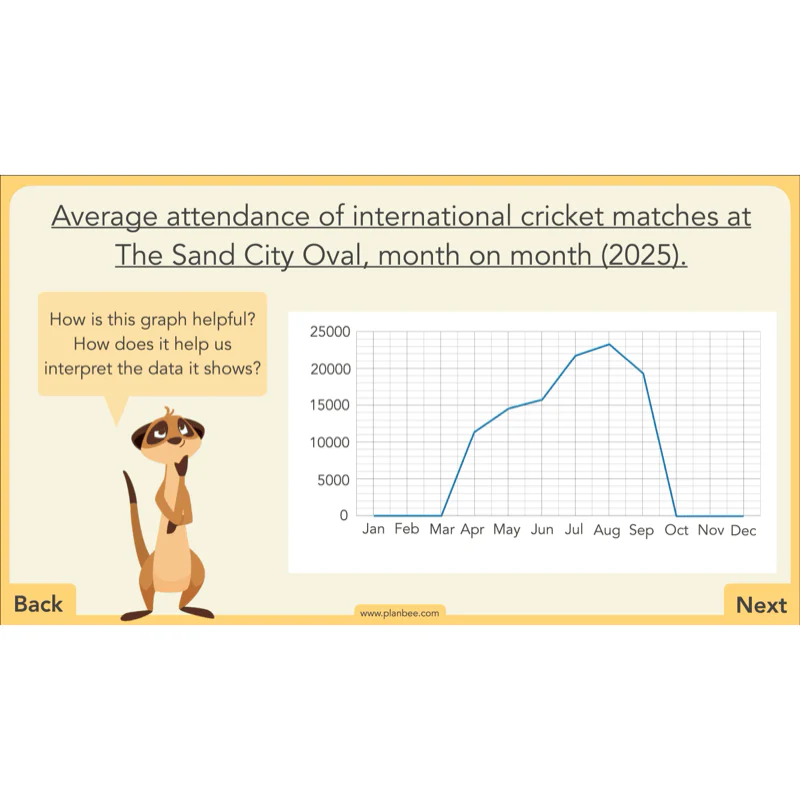
Revisit line graphs, focussing on the differences between discrete and continuous data, and how and why they may be presented in slightly different ways.Following on from this, learn how sets of data with two variables may be plotted on the same graph, and how graphs like these may be used to spot patterns and make predictions.
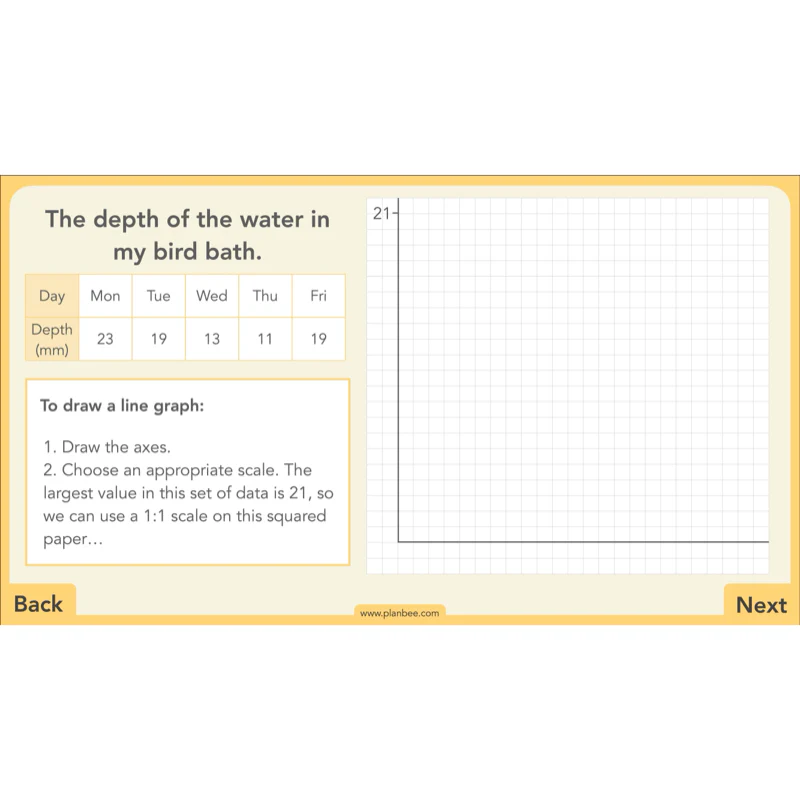
After that there’s a choice of differentiated learning activities where children will collect data in a set with two variables, either by conducting a straightforward ‘fair test’, or by recording the scores of simple playground games. Once they’ve got that data, they’re challenged to accurately present it using a line graph.
This downloadable lesson includes a lesson plan, a slideshow presentation and printable teaching resources.
What's included:
- Lesson plan
- Slides
- Activity ideas
- Differentiated ‘Heat Loss Experiment’ sheets
- Challenge card
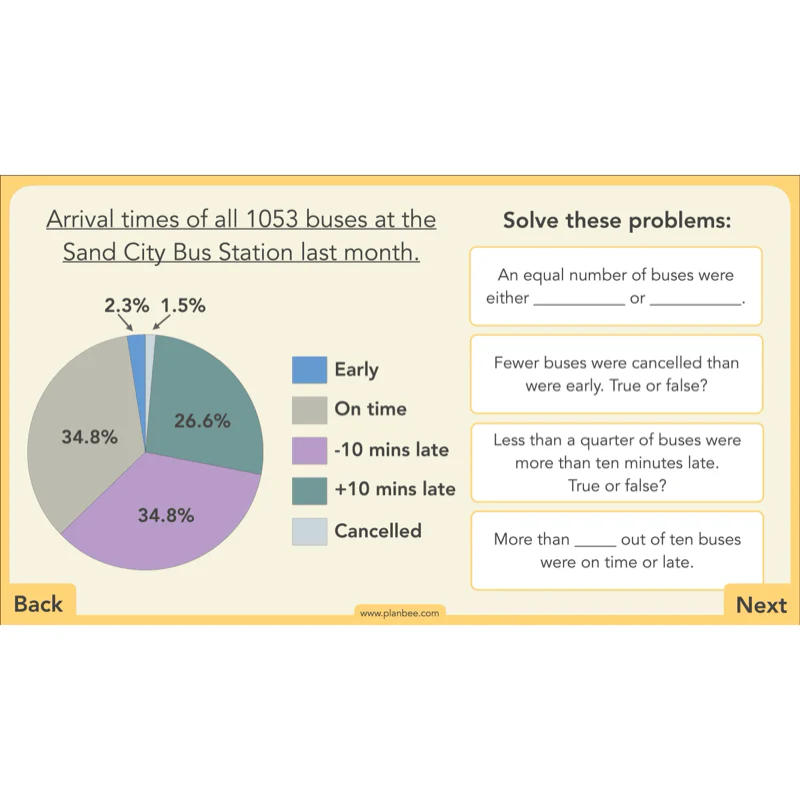
Pie Charts Part I
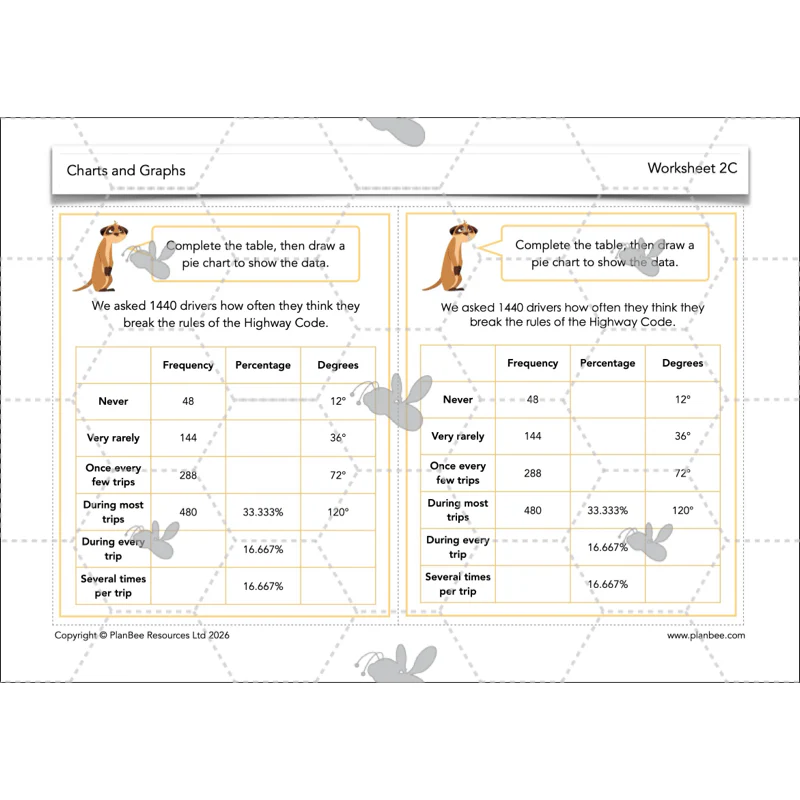
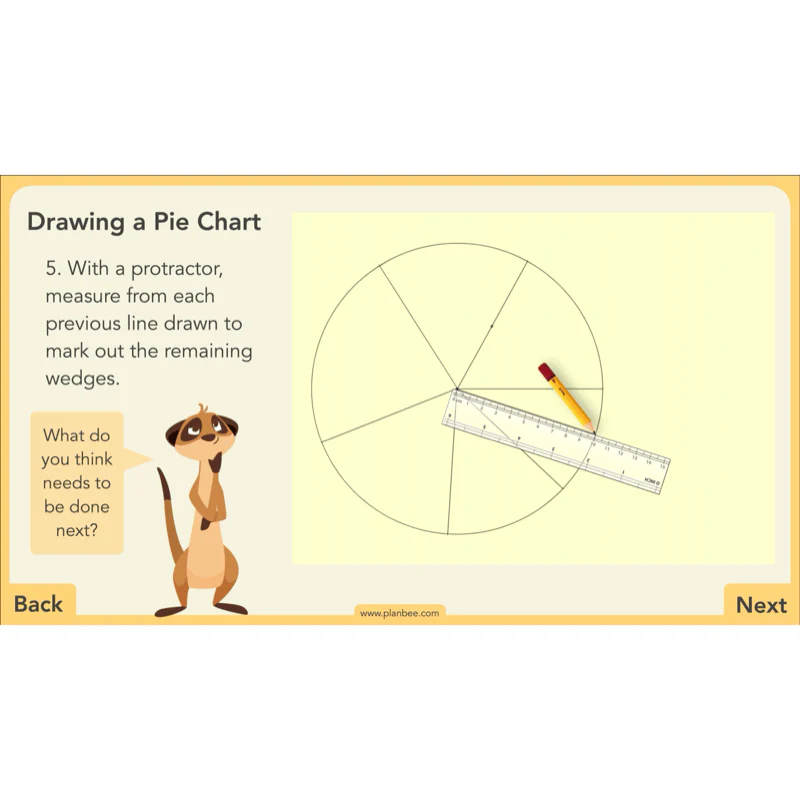
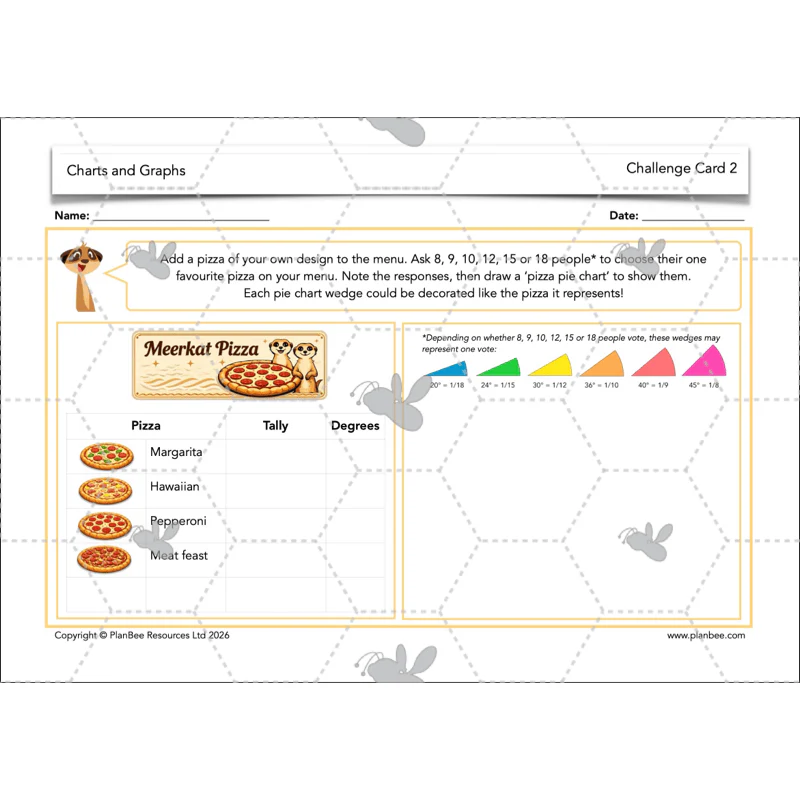
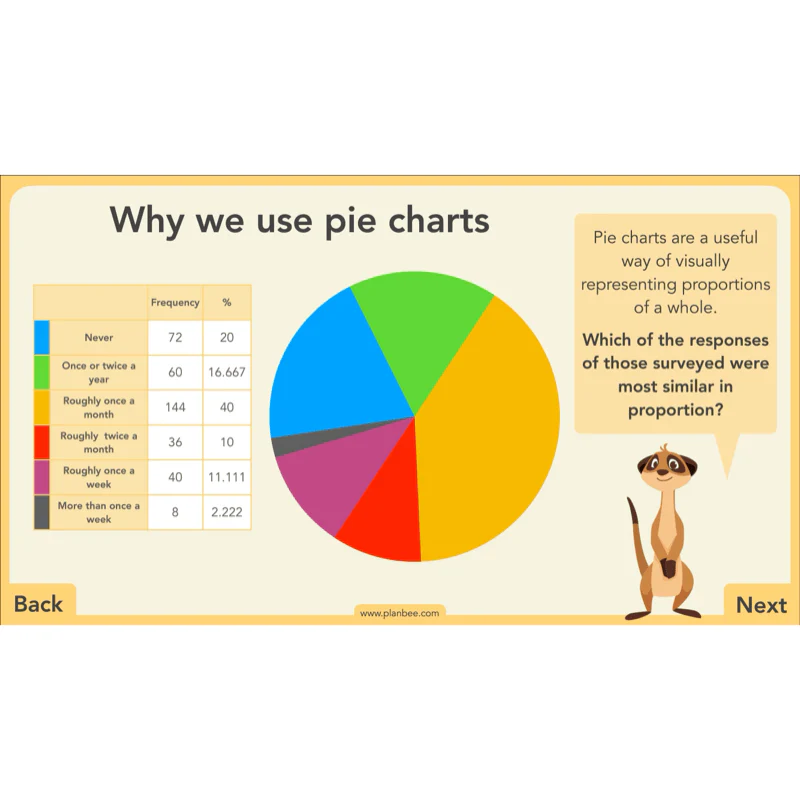
Consider reasons why pie charts are helpful, and how they differ from other types of graph. Moving on, learn how proportions of a set of data may be expressed as percentages and as proportions of 360 degrees, too.The included presentation clearly explains how to draw accurate pie charts using protractors and pairs of compasses, and how to complete tables of data with missing information. After that, there’s a choice of differentiated learning activities where children may either complete tables of survey data, or conduct one of their own, then present them using pie charts.
This downloadable lesson comes with a lesson plan, a slideshow presentation and printable teaching resources.
What's included:
- Lesson plan
- Slides
- Activity ideas
- Differentiated worksheets
- Challenge card
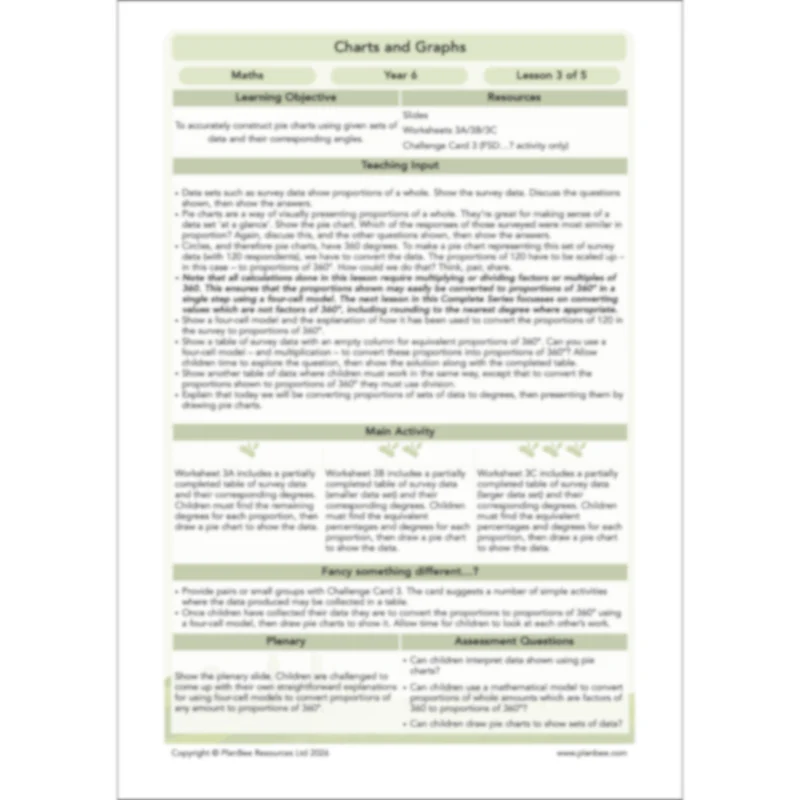
Pie Charts Part II
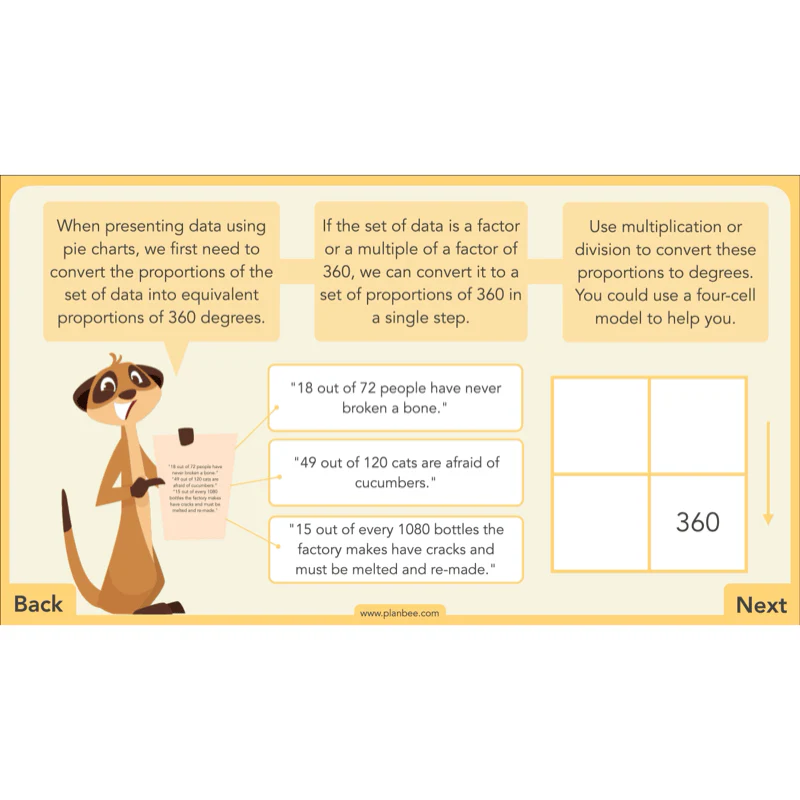
Building on prior learning about drawing pie charts accurately, start to discover how proportions of an amount may be converted to proportions of 360 degrees.
The included presentation introduces a method for converting proportions, showing how proportions which are factors (or multiples of factors) of 360 may be converted to degrees in a single step by multiplying or dividing. This method is explored in greater depth in the next lesson in this Complete Series, where children will learn how to convert ANY proportion to degrees. After that there’s a choice of differentiated learning activities where children may make pie charts either by completing given tables of data with some missing information, or by collecting their own data and converting it to degrees.
This downloadable lesson includes a lesson plan, a slideshow presentation and printable teaching resources.
What's included:
- Lesson plan
- Slides
- Activity ideas
- Differentiated worksheets
- Challenge card
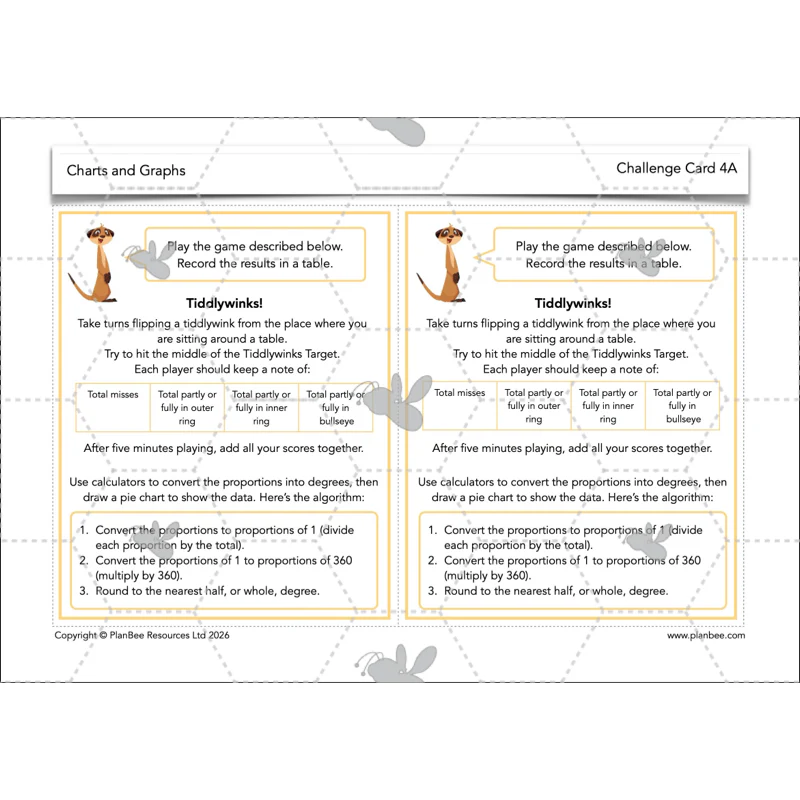
Pie Charts Part III
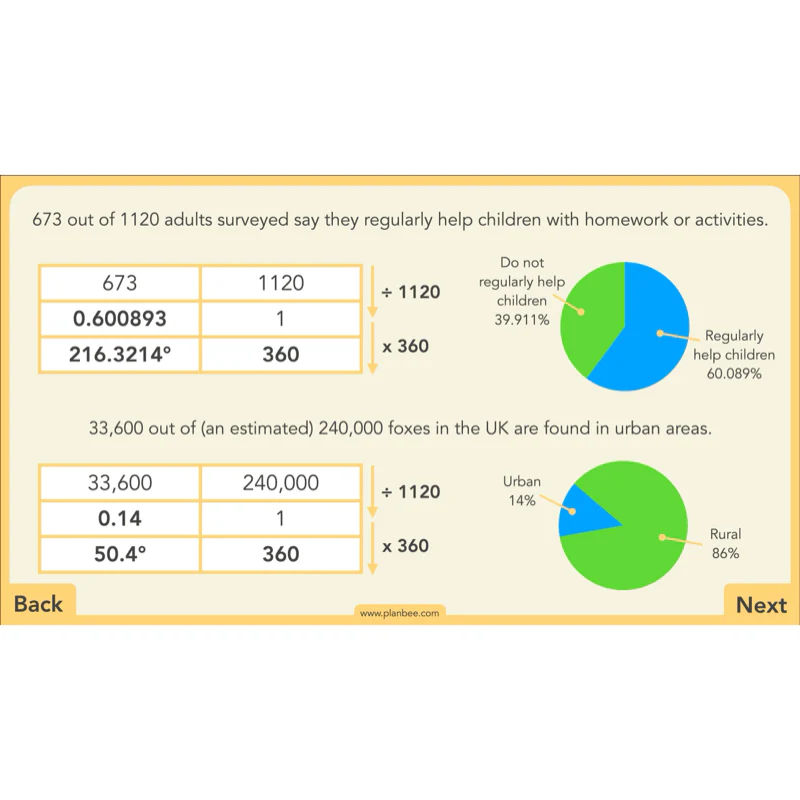
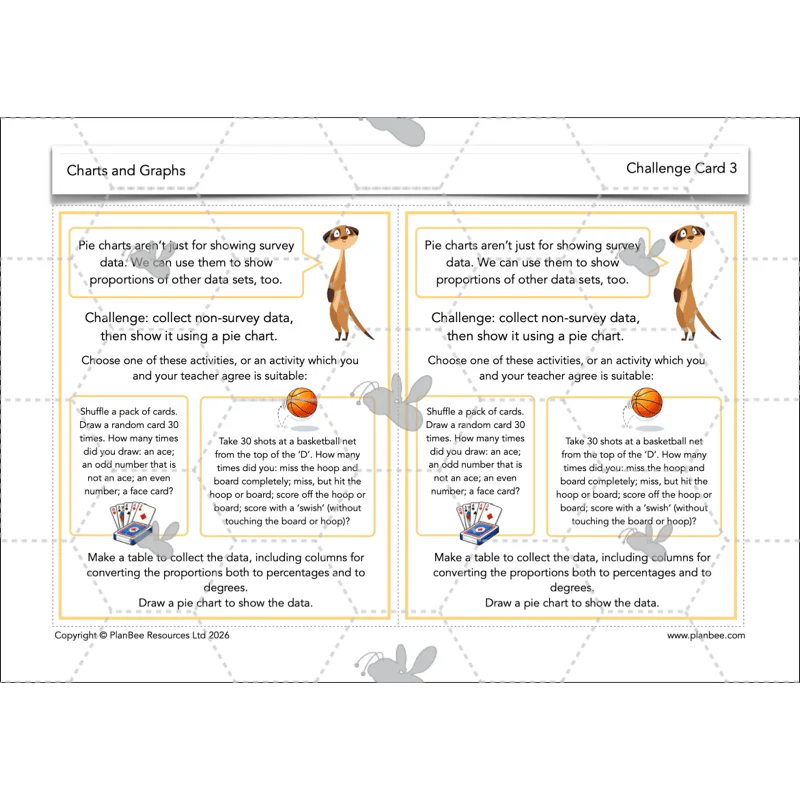
This lesson, the third focussing on pie charts within this Complete Series, includes step-by-step instructions for converting any proportion of any amount to a proportion of 360 degrees. The included presentation clearly explains this challenging multi-step method, and how calculators and rounding are required to draw pie charts showing this data as accurately as possible.
After that, there’s a choice of differentiated learning activities where children may apply all the skills they’ve learned about converting proportions and drawing pie charts.
This downloadable lesson includes a lesson plan, a slideshow presentation and printable teaching resources.
What's included:
- Lesson plan
- Slides
- Activity ideas
- Differentiated challenge cards
- Converting to Degrees help sheet
- Tiddlywinks Target sheet
Show what you know
In this, the final lesson of ‘Charts and Graphs’, children have the opportunity to demonstrate and apply their learning about line graphs and pie charts.
The included presentation recaps how different types of graph are better suited to showing certain types of data, and shows examples of common mistakes made when producing graphs using spreadsheet software. After that there’s a choice of fun, differentiated activities, both of which are ideal for assessing your class’s learning.
This downloadable lesson includes a lesson plan, a slideshow presentation and printable teaching resources.
What's included:
- Lesson plan
- Slides
- Activity ideas
- Differentiated challenge cards
- Quiz sheets
Original: $3.49
-70%$3.49
$1.05More Images


Charts and Graphs
Revisit, and build upon, the skills required to read and interpret line graphs and pie charts. Building on those skills, teach children to produce detailed, accurate and meaningful line graphs with two variables.
Three of the five lessons included with this Complete Series focus on a particularly tricky skill: converting proportions of a set of data into proportions of 360 degrees, then plotting the data accurately using pie charts. The included presentations each build upon the learning from the last, giving children the opportunity to build up their skills a little at a time.
Finally, there’s a choice of opportunities for children to demonstrate and apply their learning either by producing fun, fact-filled infographics or completing a charts and graphs quiz; either way, you’ll have all you need to accurately assess their learning!
This downloadable set of lessons includes detailed planning, engaging slideshow presentations and printable teaching resources.
Two Variables
Revisit line graphs, focussing on the differences between discrete and continuous data, and how and why they may be presented in slightly different ways.Following on from this, learn how sets of data with two variables may be plotted on the same graph, and how graphs like these may be used to spot patterns and make predictions.
After that there’s a choice of differentiated learning activities where children will collect data in a set with two variables, either by conducting a straightforward ‘fair test’, or by recording the scores of simple playground games. Once they’ve got that data, they’re challenged to accurately present it using a line graph.
This downloadable lesson includes a lesson plan, a slideshow presentation and printable teaching resources.
What's included:
- Lesson plan
- Slides
- Activity ideas
- Differentiated ‘Heat Loss Experiment’ sheets
- Challenge card
Pie Charts Part I
Consider reasons why pie charts are helpful, and how they differ from other types of graph. Moving on, learn how proportions of a set of data may be expressed as percentages and as proportions of 360 degrees, too.The included presentation clearly explains how to draw accurate pie charts using protractors and pairs of compasses, and how to complete tables of data with missing information. After that, there’s a choice of differentiated learning activities where children may either complete tables of survey data, or conduct one of their own, then present them using pie charts.
This downloadable lesson comes with a lesson plan, a slideshow presentation and printable teaching resources.
What's included:
- Lesson plan
- Slides
- Activity ideas
- Differentiated worksheets
- Challenge card
Pie Charts Part II
Building on prior learning about drawing pie charts accurately, start to discover how proportions of an amount may be converted to proportions of 360 degrees.
The included presentation introduces a method for converting proportions, showing how proportions which are factors (or multiples of factors) of 360 may be converted to degrees in a single step by multiplying or dividing. This method is explored in greater depth in the next lesson in this Complete Series, where children will learn how to convert ANY proportion to degrees. After that there’s a choice of differentiated learning activities where children may make pie charts either by completing given tables of data with some missing information, or by collecting their own data and converting it to degrees.
This downloadable lesson includes a lesson plan, a slideshow presentation and printable teaching resources.
What's included:
- Lesson plan
- Slides
- Activity ideas
- Differentiated worksheets
- Challenge card
Pie Charts Part III
This lesson, the third focussing on pie charts within this Complete Series, includes step-by-step instructions for converting any proportion of any amount to a proportion of 360 degrees. The included presentation clearly explains this challenging multi-step method, and how calculators and rounding are required to draw pie charts showing this data as accurately as possible.
After that, there’s a choice of differentiated learning activities where children may apply all the skills they’ve learned about converting proportions and drawing pie charts.
This downloadable lesson includes a lesson plan, a slideshow presentation and printable teaching resources.
What's included:
- Lesson plan
- Slides
- Activity ideas
- Differentiated challenge cards
- Converting to Degrees help sheet
- Tiddlywinks Target sheet
Show what you know
In this, the final lesson of ‘Charts and Graphs’, children have the opportunity to demonstrate and apply their learning about line graphs and pie charts.
The included presentation recaps how different types of graph are better suited to showing certain types of data, and shows examples of common mistakes made when producing graphs using spreadsheet software. After that there’s a choice of fun, differentiated activities, both of which are ideal for assessing your class’s learning.
This downloadable lesson includes a lesson plan, a slideshow presentation and printable teaching resources.
What's included:
- Lesson plan
- Slides
- Activity ideas
- Differentiated challenge cards
- Quiz sheets
Product Information
Product Information
Shipping & Returns
Shipping & Returns
Description
Revisit, and build upon, the skills required to read and interpret line graphs and pie charts. Building on those skills, teach children to produce detailed, accurate and meaningful line graphs with two variables.
Three of the five lessons included with this Complete Series focus on a particularly tricky skill: converting proportions of a set of data into proportions of 360 degrees, then plotting the data accurately using pie charts. The included presentations each build upon the learning from the last, giving children the opportunity to build up their skills a little at a time.
Finally, there’s a choice of opportunities for children to demonstrate and apply their learning either by producing fun, fact-filled infographics or completing a charts and graphs quiz; either way, you’ll have all you need to accurately assess their learning!
This downloadable set of lessons includes detailed planning, engaging slideshow presentations and printable teaching resources.
Two Variables
Revisit line graphs, focussing on the differences between discrete and continuous data, and how and why they may be presented in slightly different ways.Following on from this, learn how sets of data with two variables may be plotted on the same graph, and how graphs like these may be used to spot patterns and make predictions.
After that there’s a choice of differentiated learning activities where children will collect data in a set with two variables, either by conducting a straightforward ‘fair test’, or by recording the scores of simple playground games. Once they’ve got that data, they’re challenged to accurately present it using a line graph.
This downloadable lesson includes a lesson plan, a slideshow presentation and printable teaching resources.
What's included:
- Lesson plan
- Slides
- Activity ideas
- Differentiated ‘Heat Loss Experiment’ sheets
- Challenge card
Pie Charts Part I
Consider reasons why pie charts are helpful, and how they differ from other types of graph. Moving on, learn how proportions of a set of data may be expressed as percentages and as proportions of 360 degrees, too.The included presentation clearly explains how to draw accurate pie charts using protractors and pairs of compasses, and how to complete tables of data with missing information. After that, there’s a choice of differentiated learning activities where children may either complete tables of survey data, or conduct one of their own, then present them using pie charts.
This downloadable lesson comes with a lesson plan, a slideshow presentation and printable teaching resources.
What's included:
- Lesson plan
- Slides
- Activity ideas
- Differentiated worksheets
- Challenge card
Pie Charts Part II
Building on prior learning about drawing pie charts accurately, start to discover how proportions of an amount may be converted to proportions of 360 degrees.
The included presentation introduces a method for converting proportions, showing how proportions which are factors (or multiples of factors) of 360 may be converted to degrees in a single step by multiplying or dividing. This method is explored in greater depth in the next lesson in this Complete Series, where children will learn how to convert ANY proportion to degrees. After that there’s a choice of differentiated learning activities where children may make pie charts either by completing given tables of data with some missing information, or by collecting their own data and converting it to degrees.
This downloadable lesson includes a lesson plan, a slideshow presentation and printable teaching resources.
What's included:
- Lesson plan
- Slides
- Activity ideas
- Differentiated worksheets
- Challenge card
Pie Charts Part III
This lesson, the third focussing on pie charts within this Complete Series, includes step-by-step instructions for converting any proportion of any amount to a proportion of 360 degrees. The included presentation clearly explains this challenging multi-step method, and how calculators and rounding are required to draw pie charts showing this data as accurately as possible.
After that, there’s a choice of differentiated learning activities where children may apply all the skills they’ve learned about converting proportions and drawing pie charts.
This downloadable lesson includes a lesson plan, a slideshow presentation and printable teaching resources.
What's included:
- Lesson plan
- Slides
- Activity ideas
- Differentiated challenge cards
- Converting to Degrees help sheet
- Tiddlywinks Target sheet
Show what you know
In this, the final lesson of ‘Charts and Graphs’, children have the opportunity to demonstrate and apply their learning about line graphs and pie charts.
The included presentation recaps how different types of graph are better suited to showing certain types of data, and shows examples of common mistakes made when producing graphs using spreadsheet software. After that there’s a choice of fun, differentiated activities, both of which are ideal for assessing your class’s learning.
This downloadable lesson includes a lesson plan, a slideshow presentation and printable teaching resources.
What's included:
- Lesson plan
- Slides
- Activity ideas
- Differentiated challenge cards
- Quiz sheets