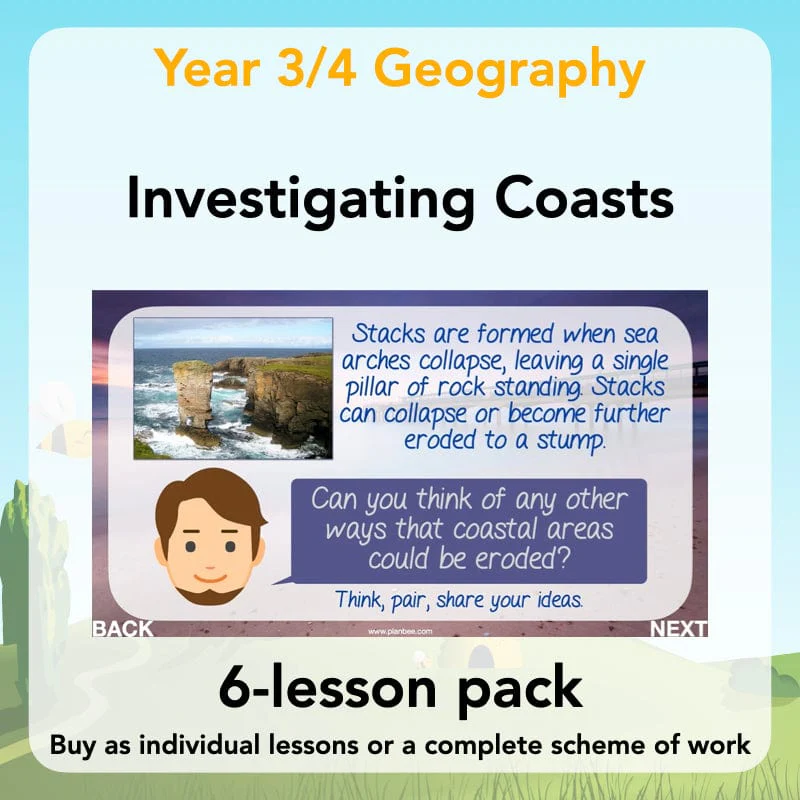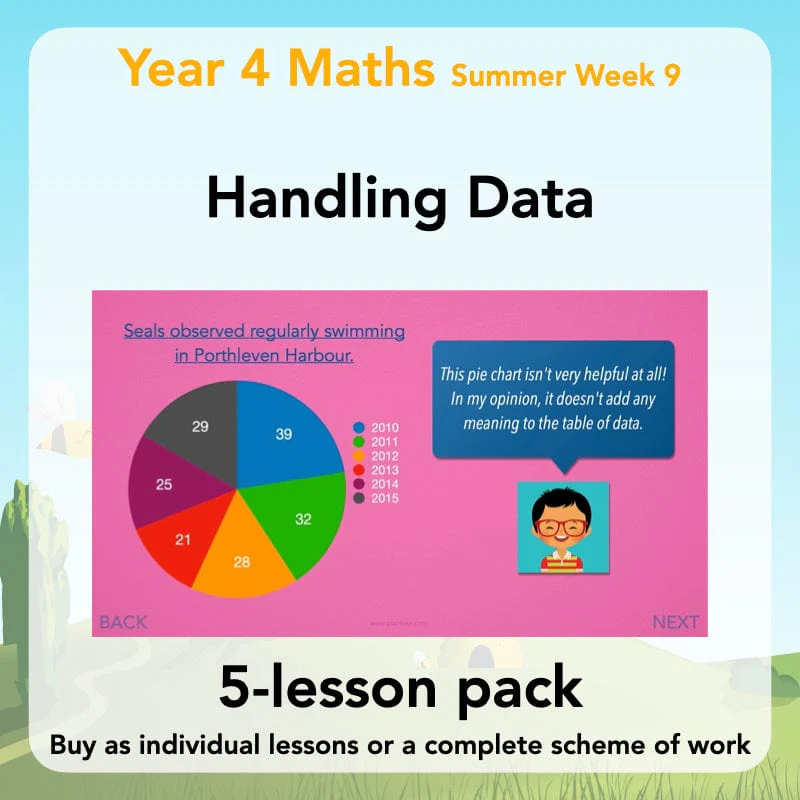
Handling Data
Move beyond the mechanics of making bar charts and line graphs, and focus on how they can be used to make meaning from sets of data, how they can show trends and help make predictions, and how selecting an appropriate style of graph is important when you’re trying to make a set of data easier to read and understand.
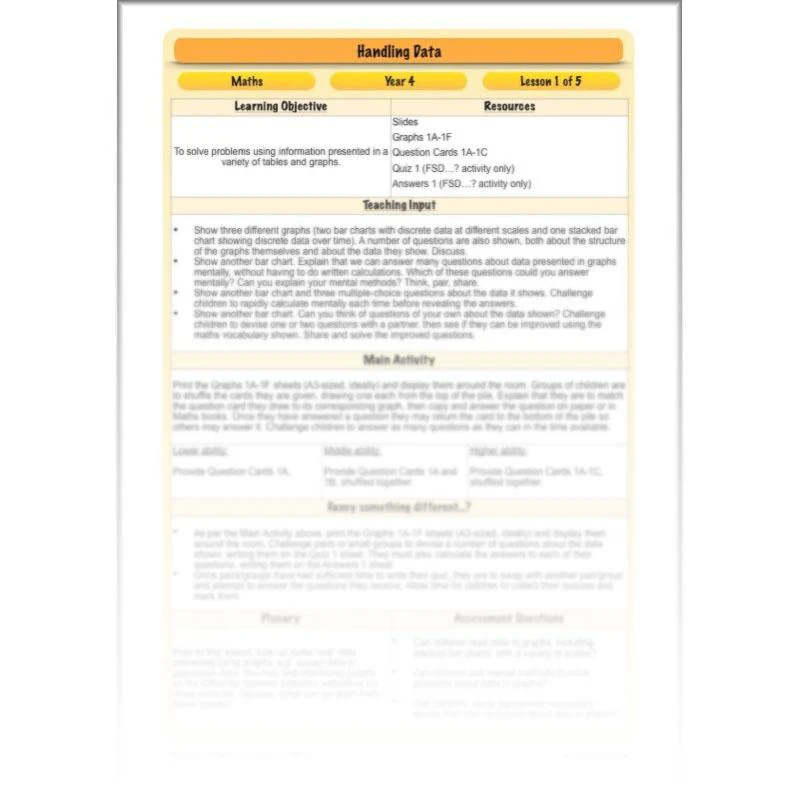
Kicking things off, the first lesson in this Complete Series briefly recaps features of bar charts, then challenges children to read and interpret them while writing and solving problems. After that, the scope of these Year 4 Maths lessons widens, exploring ways of designing and conducting effective surveys, avoiding common mistakes when drawing or reading graphs – both when drawing them on paper and when using spreadsheet software, working with ‘big’ numbers, and even making and using stacked bar charts and line graphs to show time data.
There’s heaps of printable resources included with these five lessons, designed to help your class access the learning and work increasingly independently. As always, the plans include a choice of well-differentiated activities. If you’re looking to help your children make progress with their statistics learning as they move into upper Key Stage 2, these lessons are probably just what you need!
Reading Bar Charts
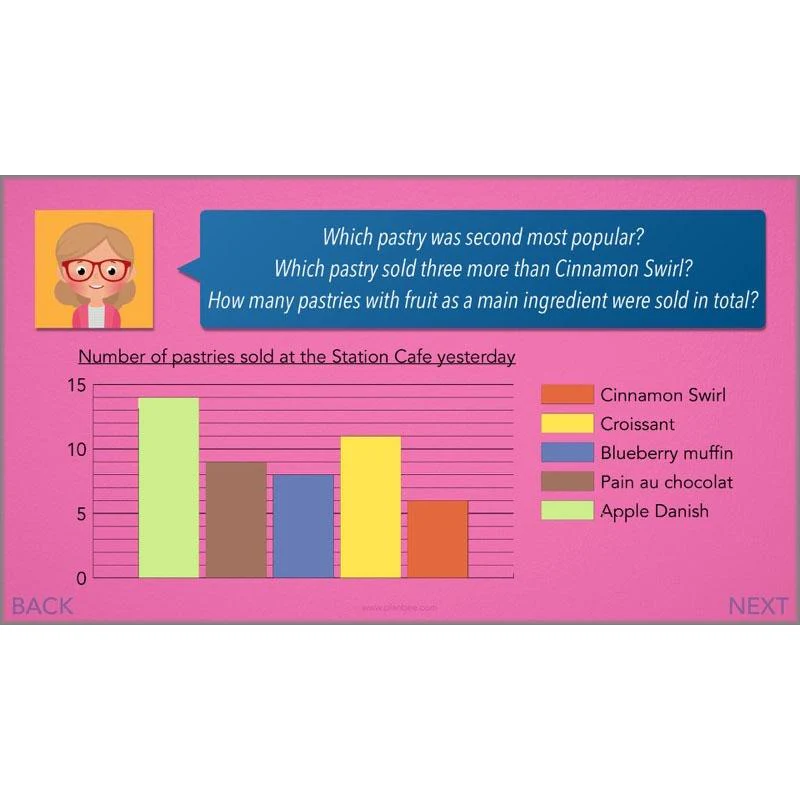
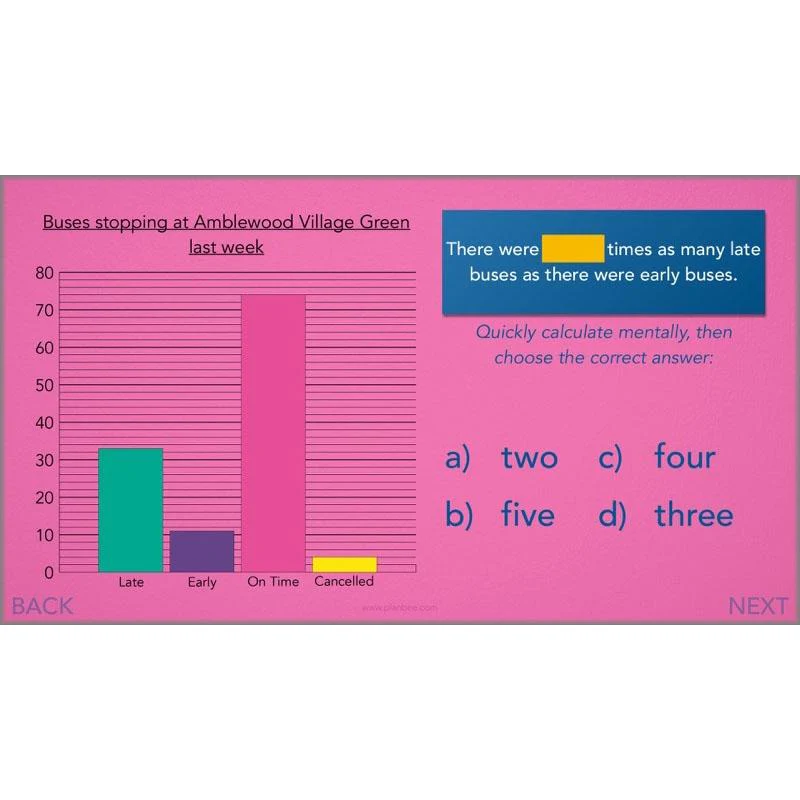
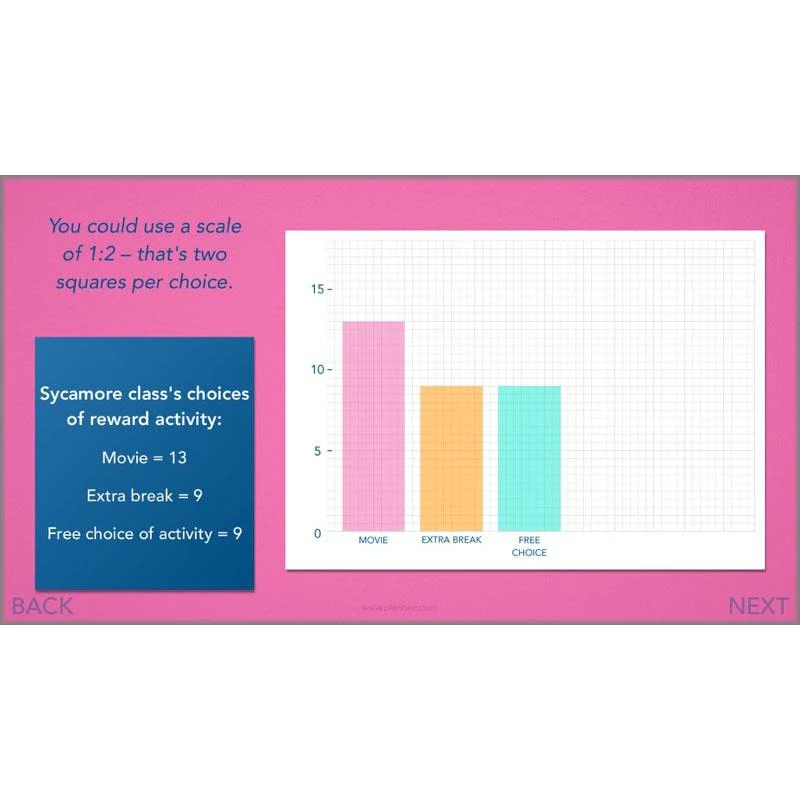
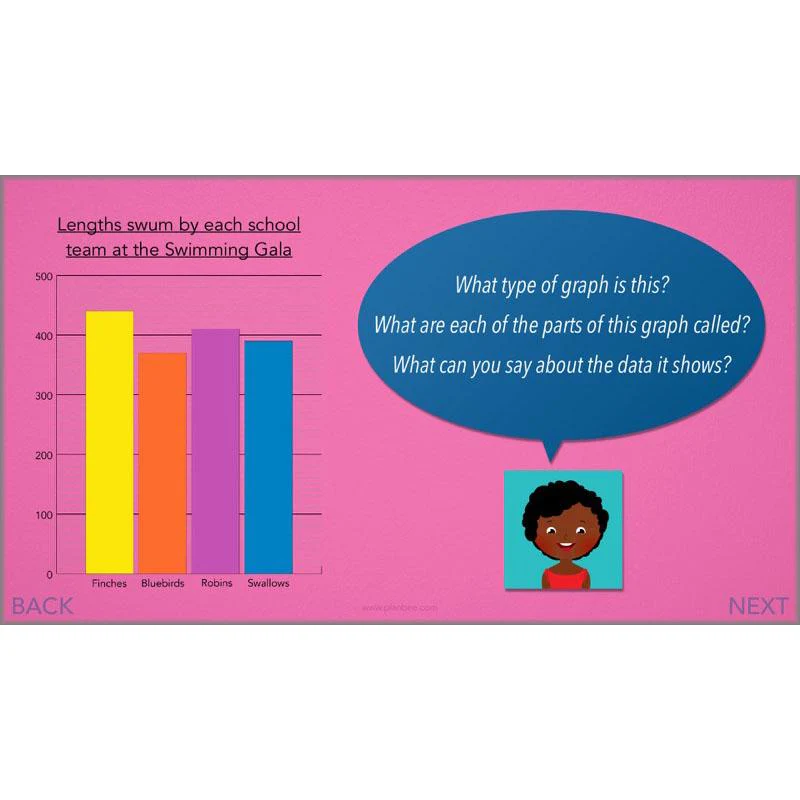
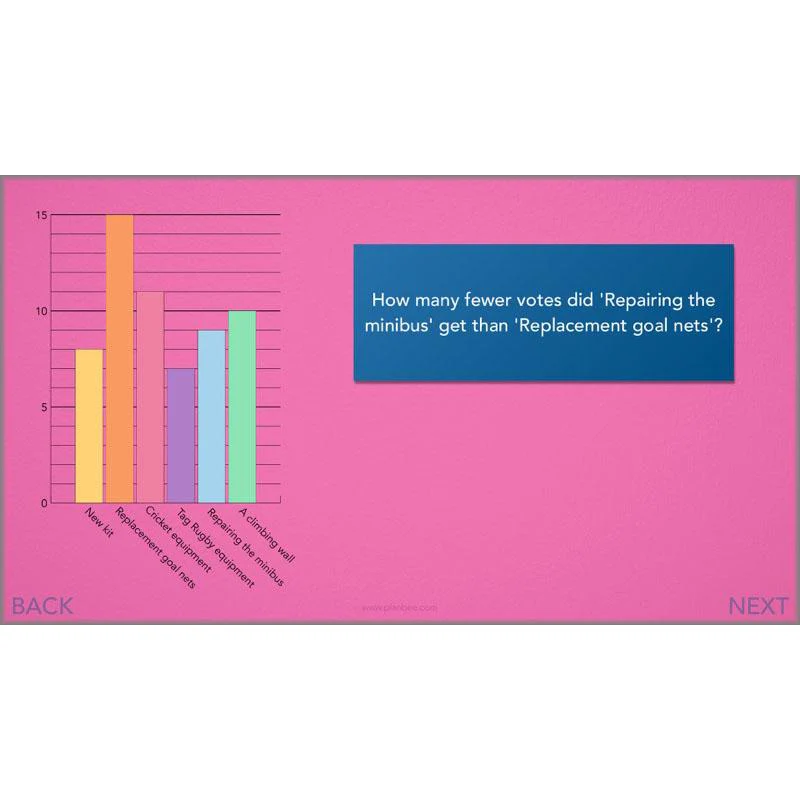
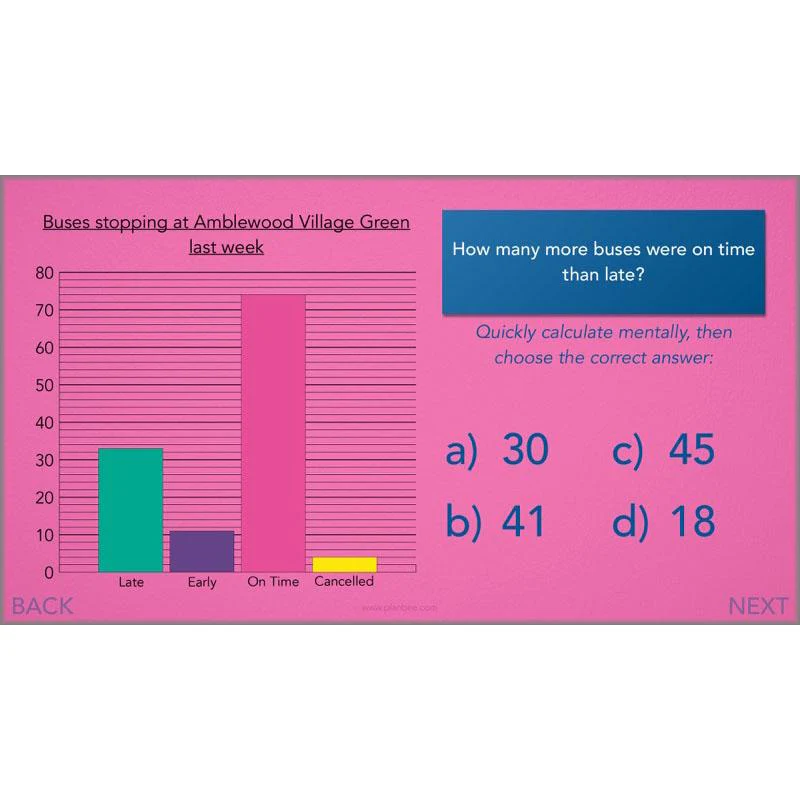
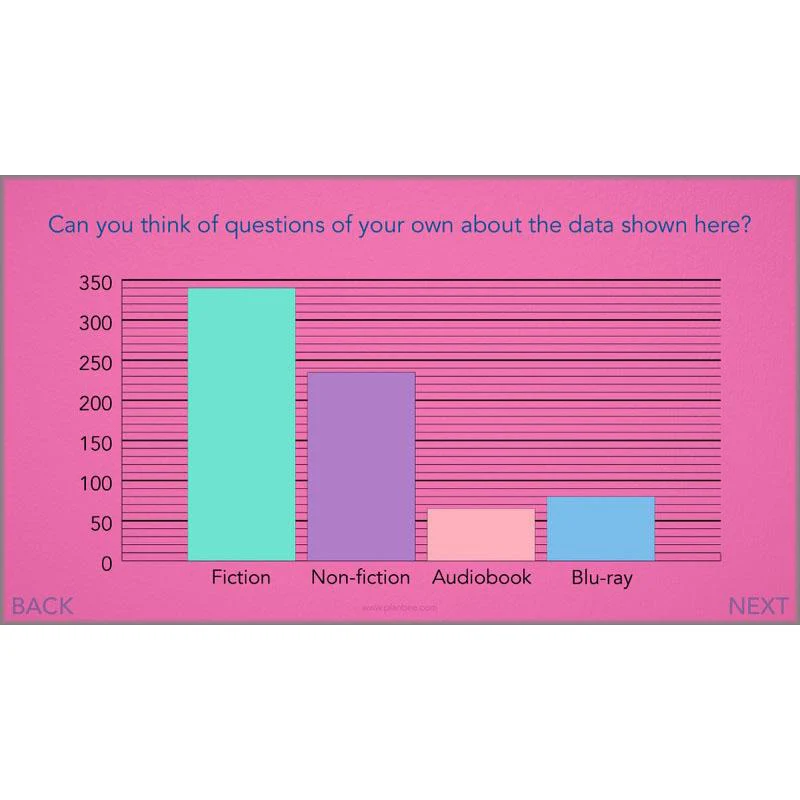
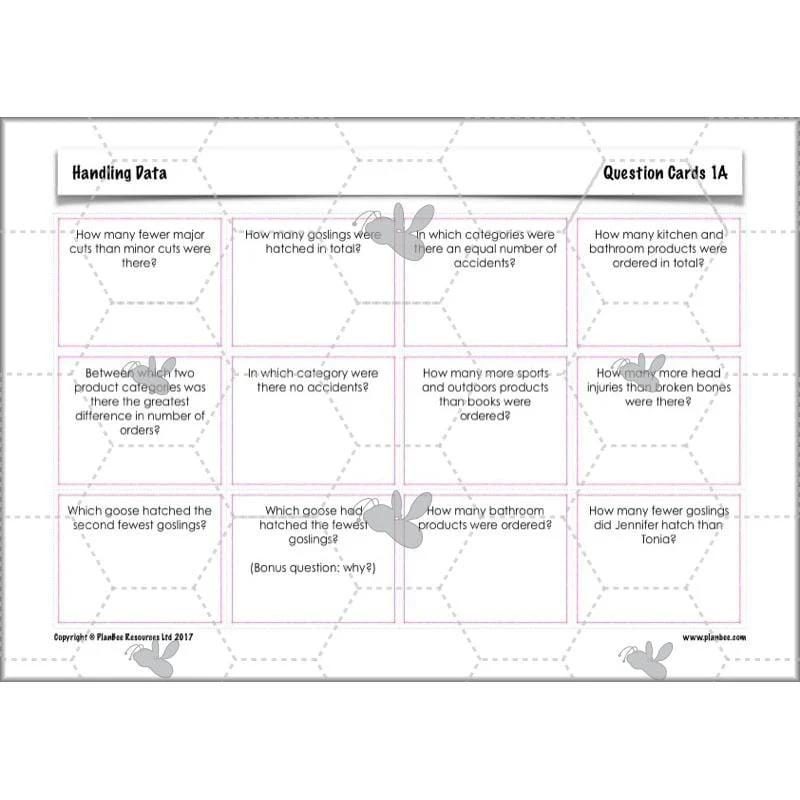
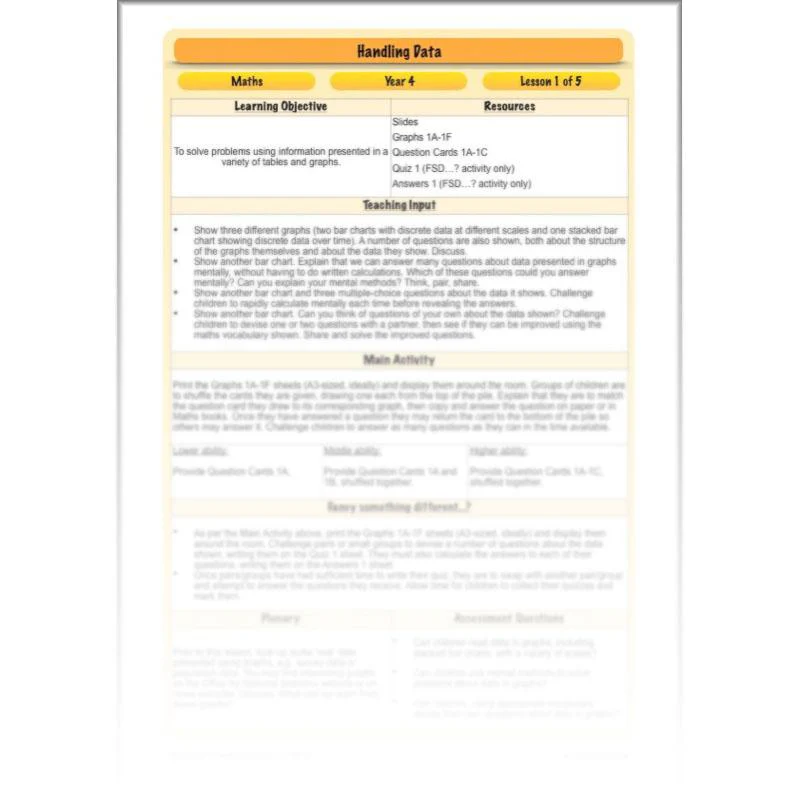
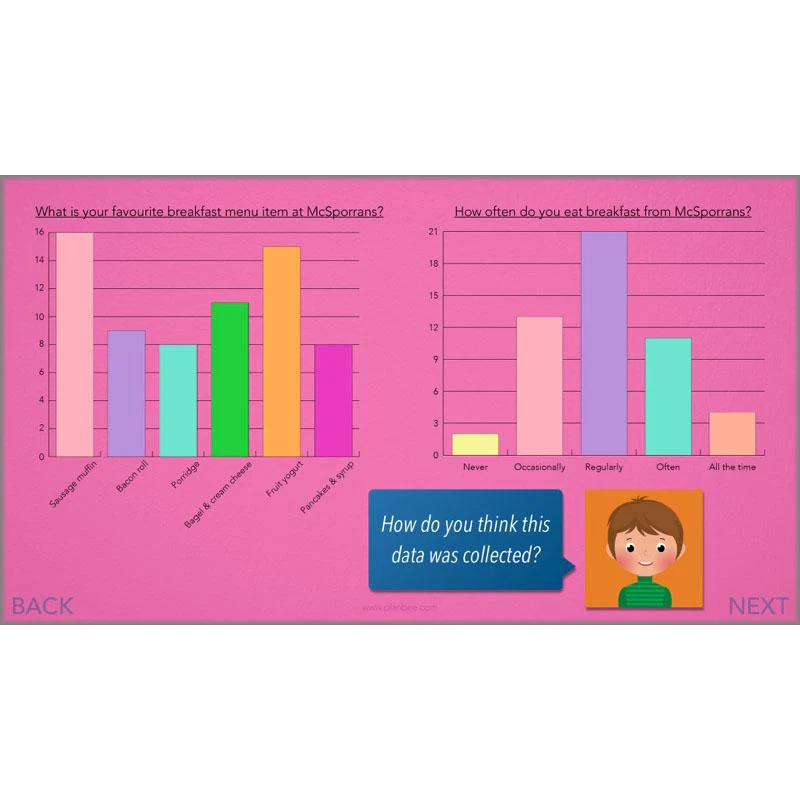
Briefly recap features of bar charts, then challenge children to mentally solve problems by reading and interpreting data given in bar charts. As they become increasingly competent doing so, next challenge them to write and improve problems of their own which may be solved by interpreting data in graphs. After that there’s a choice of two, differentiated activities where children can ask and answer challenging questions about bar charts displayed around the room.
This downloadable lesson comes with a lesson plan, a slideshow presentation and printable teaching resources.
What's included:
- Lesson plan
- Slides
- Activity ideas
- Graphs
- Question cards
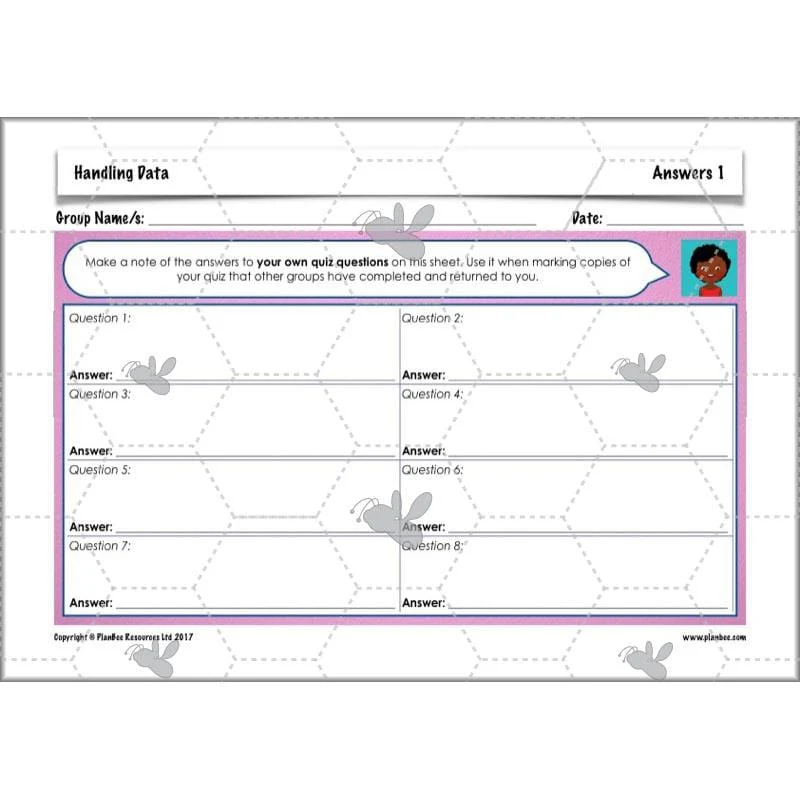
- Quiz sheet
- Answer sheet
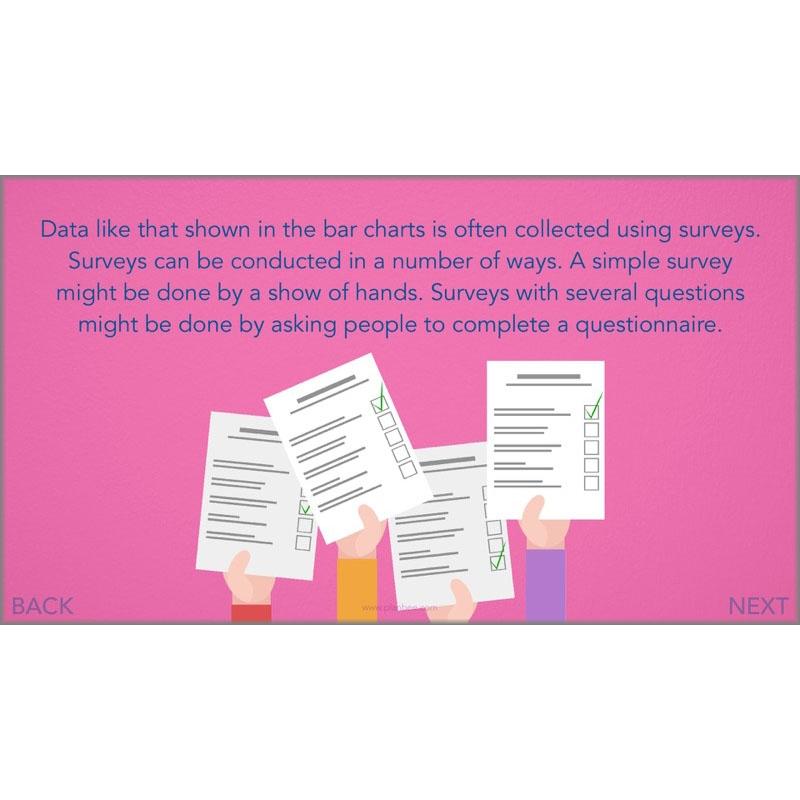
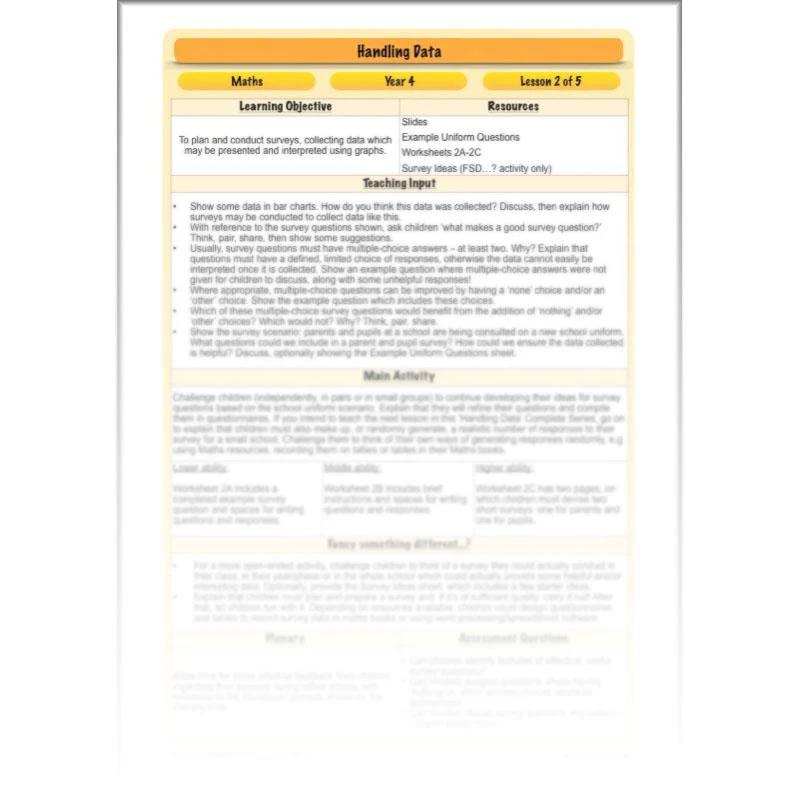
Planning Surveys
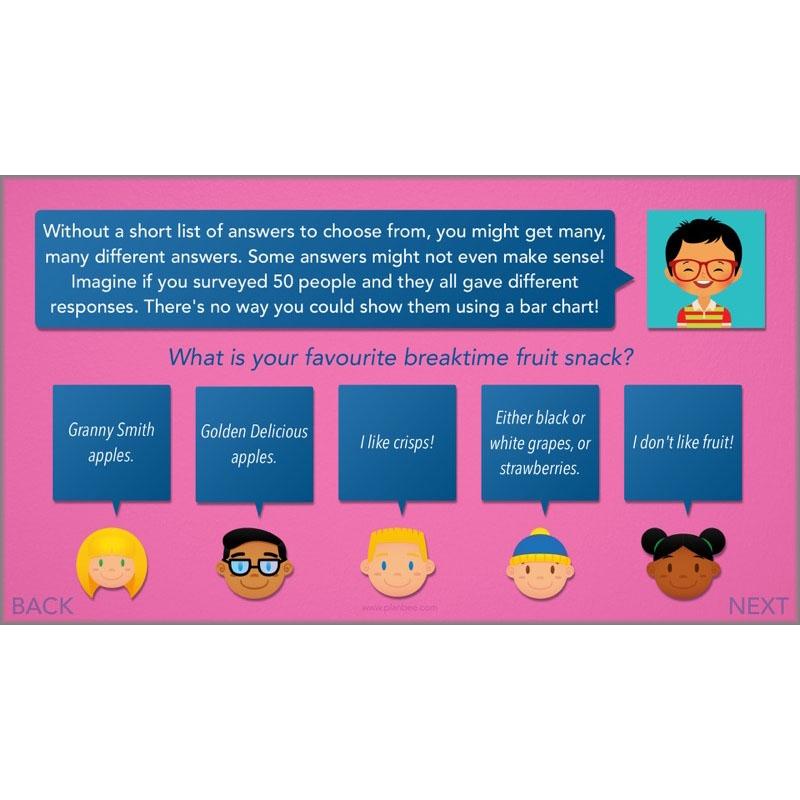
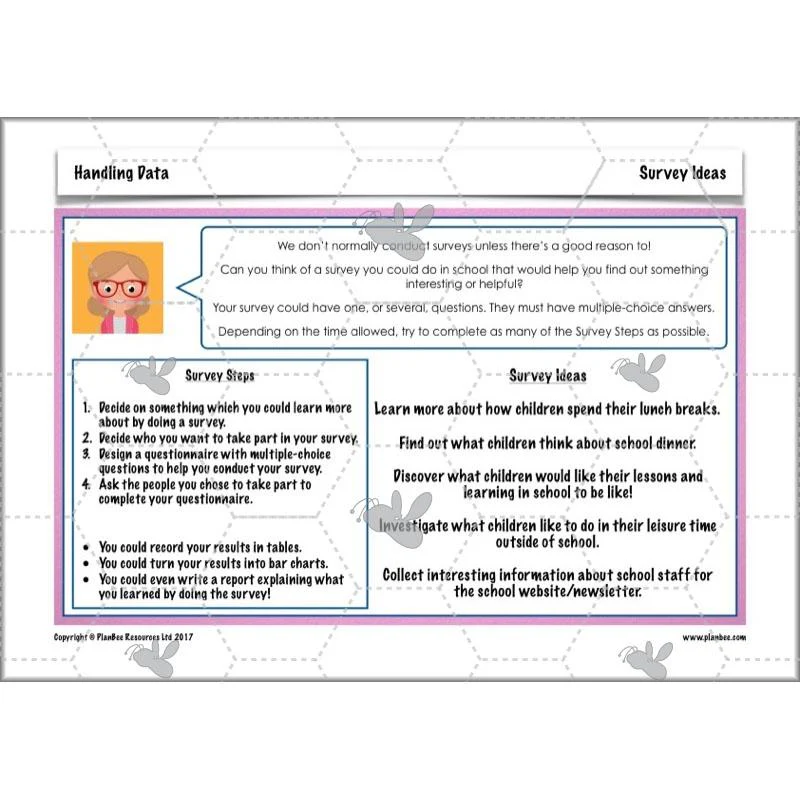
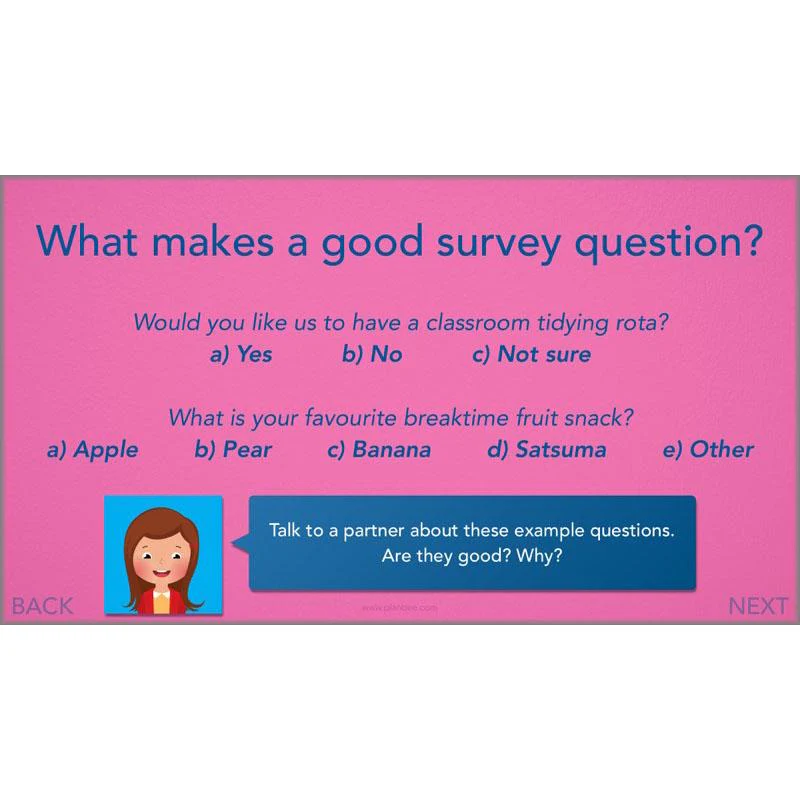
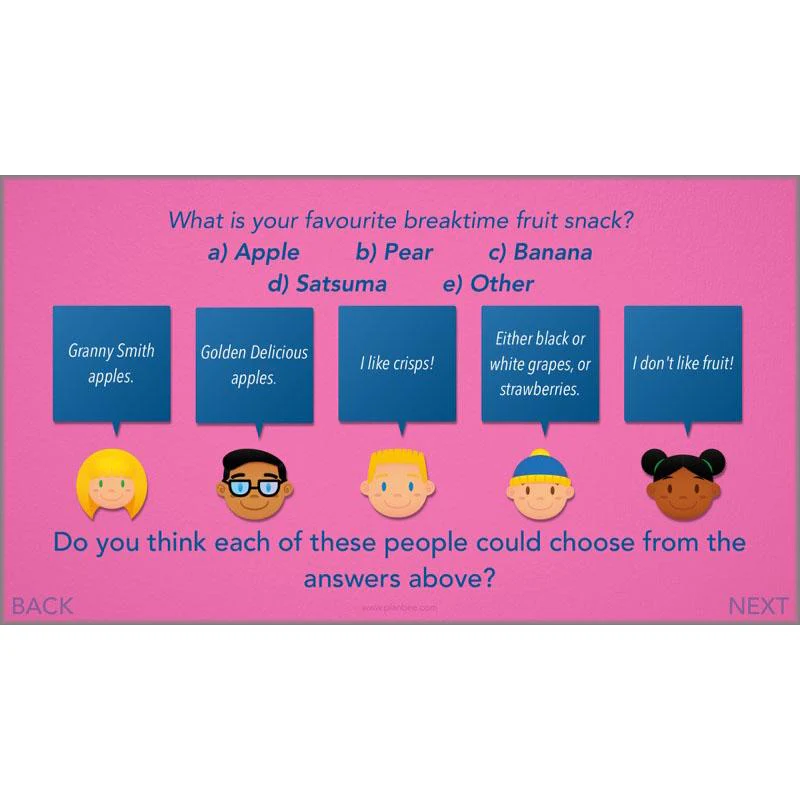
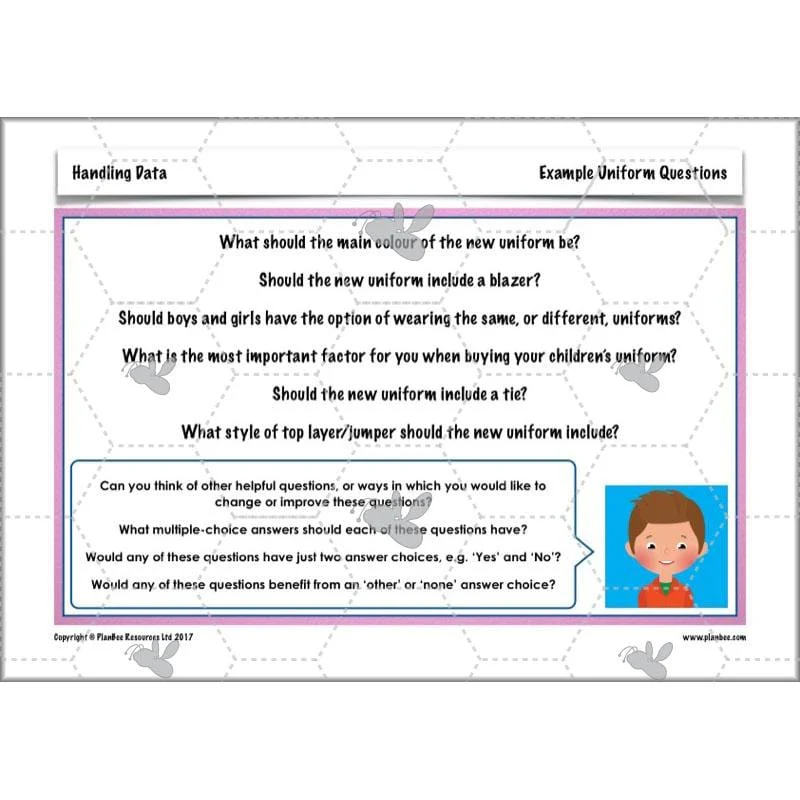
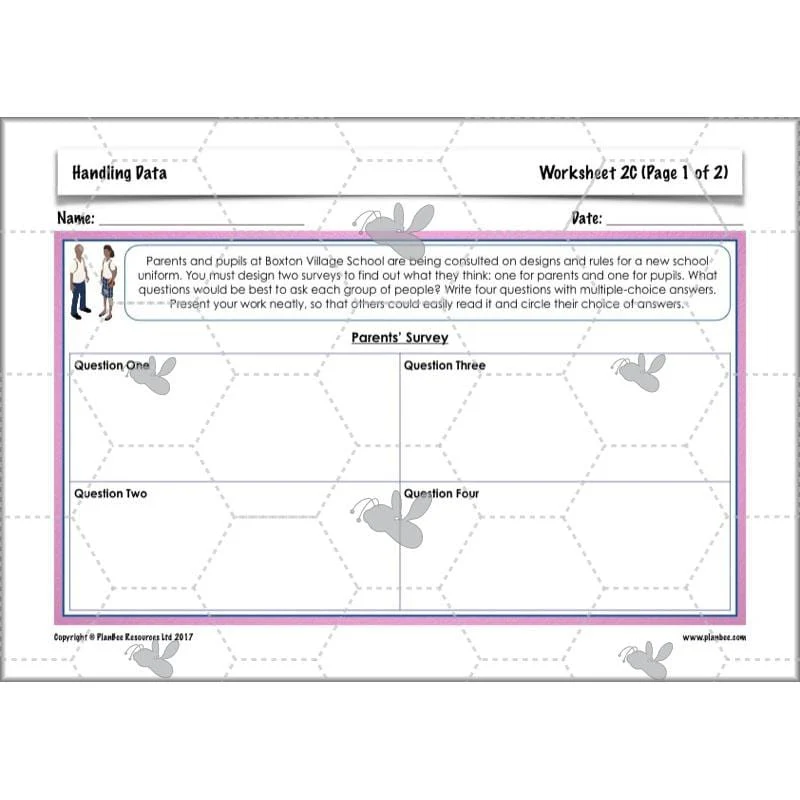
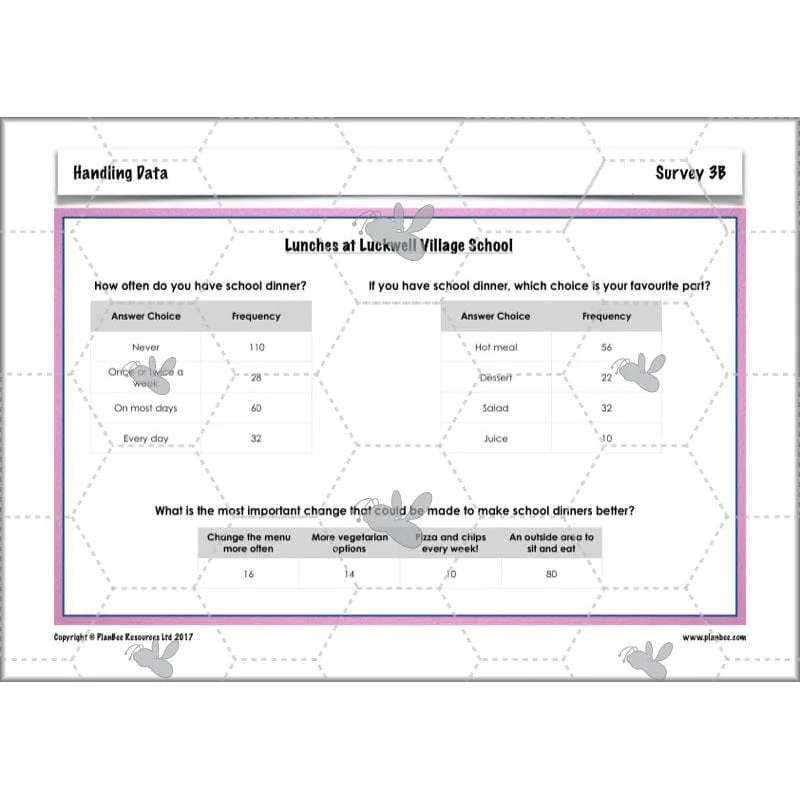
Challenge children to consider how surveys are conducted and what makes a ‘good’ survey question. The included slides explain why survey questions must have multiple-choice questions if they are to be presented and interpreted using graphs, and challenge children to consider if and when having ‘other’ or ‘nothing’ answer choices may be appropriate.
After that, there’s a choice of differentiated activities for your class to tackle, where they’ll either devise survey questionnaires for a given scenario or choose one of their own.
This downloadable lesson comes with a lesson plan, a slideshow presentation and printable teaching resources.
What's included:
- Lesson plan
- Slides
- Activity ideas
- Example questions sheet
- Differentiated worksheets
- Survey ideas sheet
Presenting Survey Data
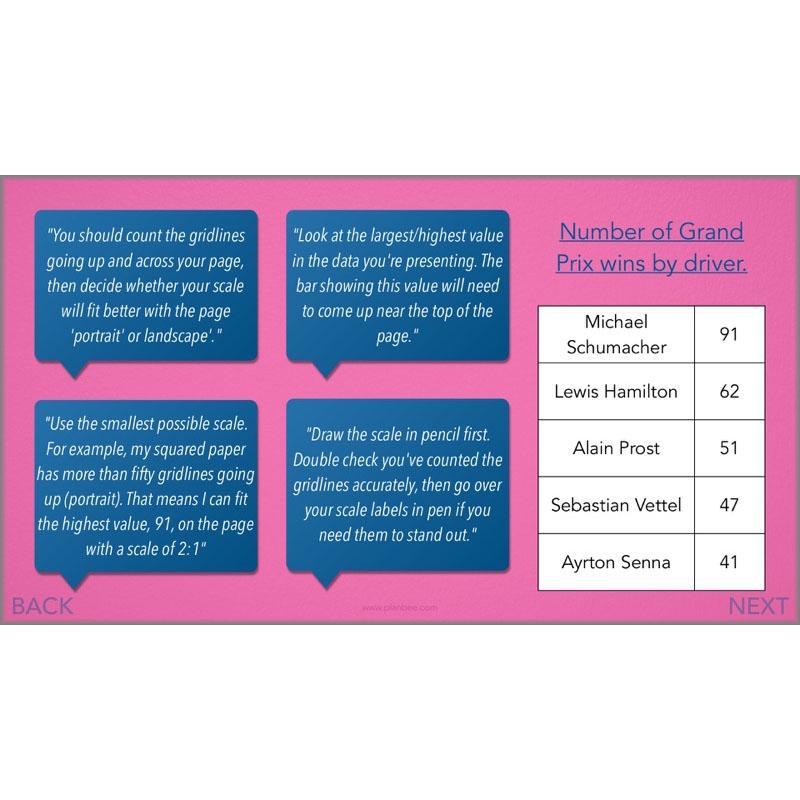
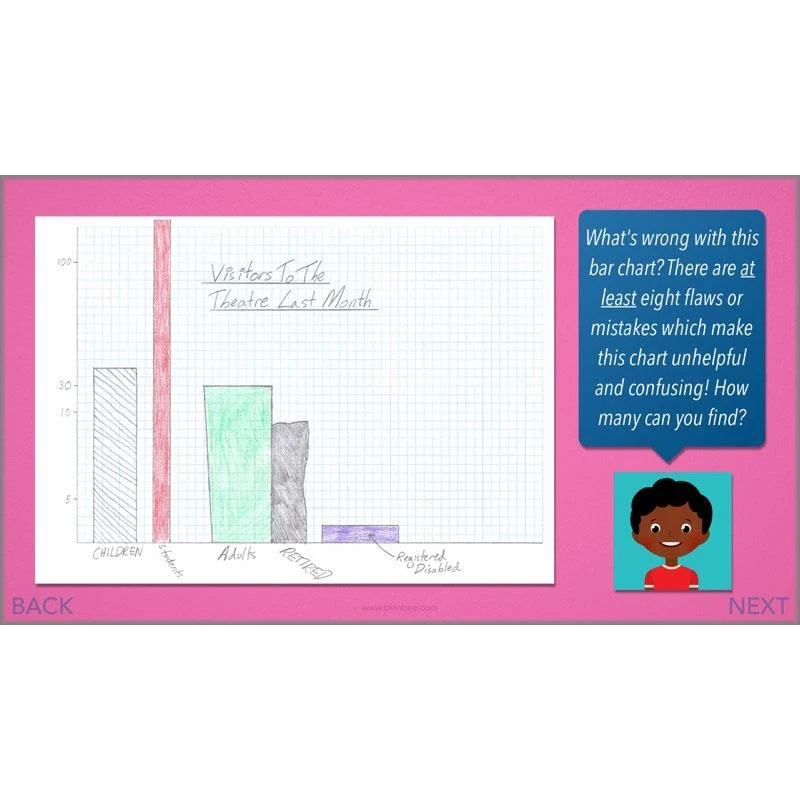
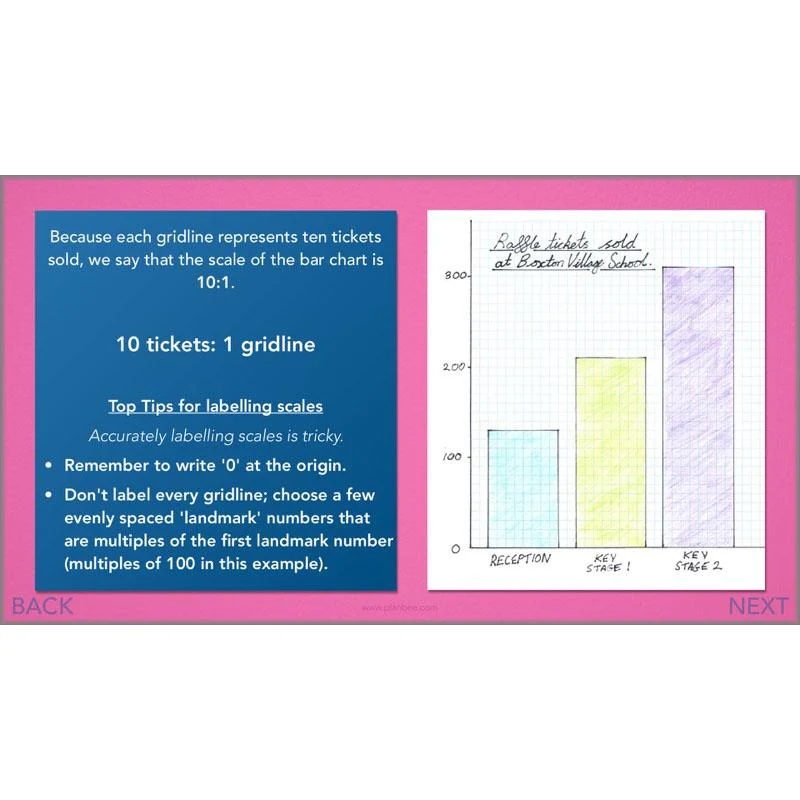
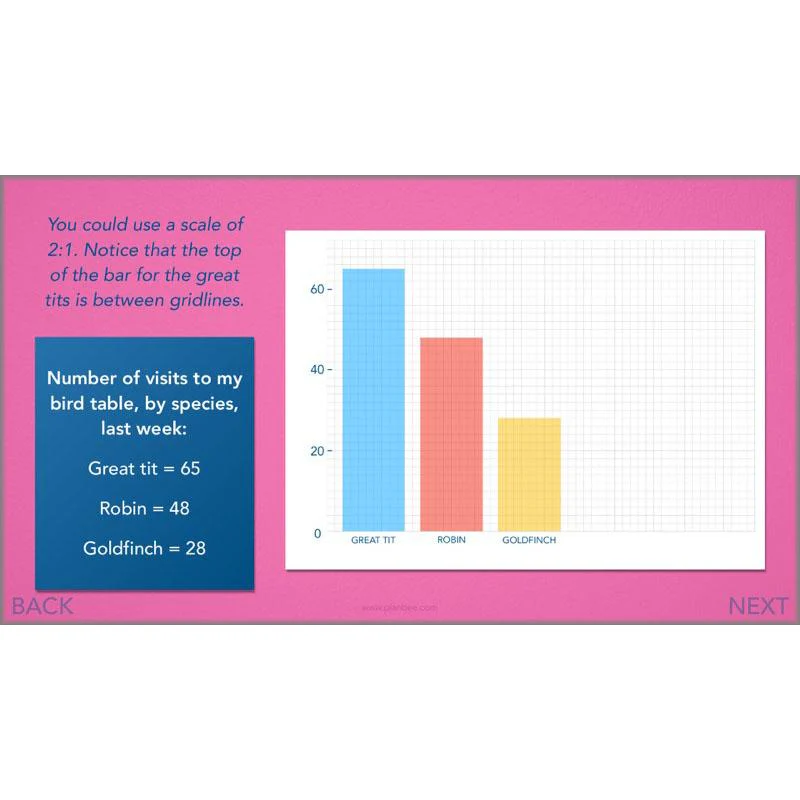
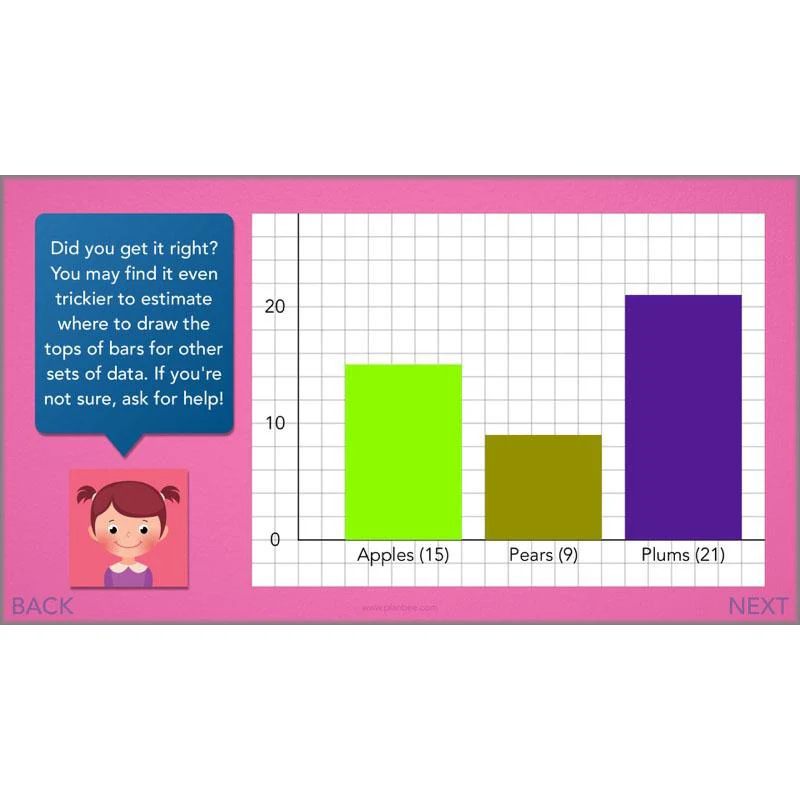
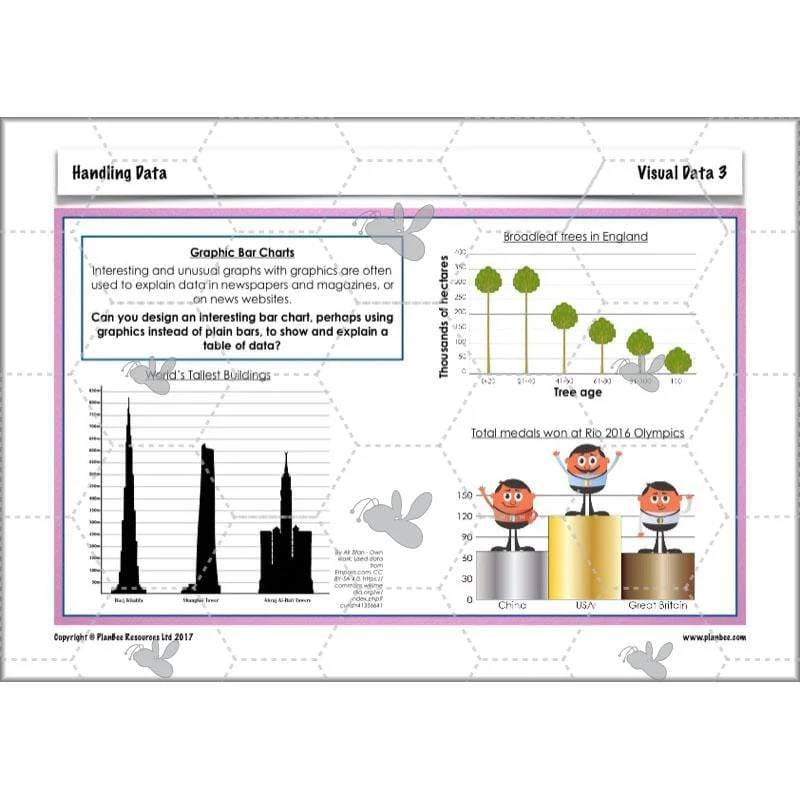
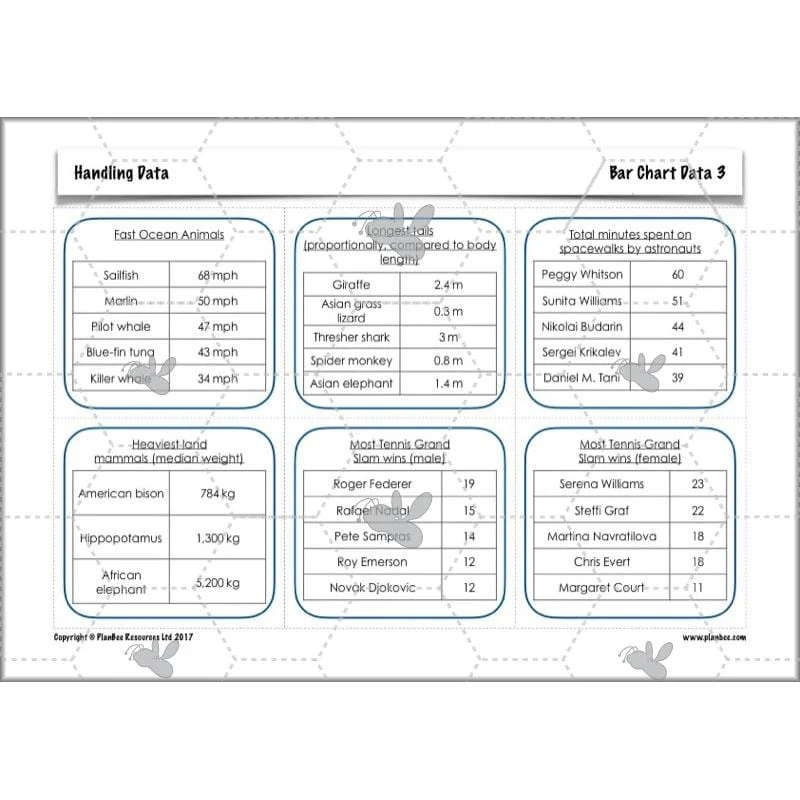
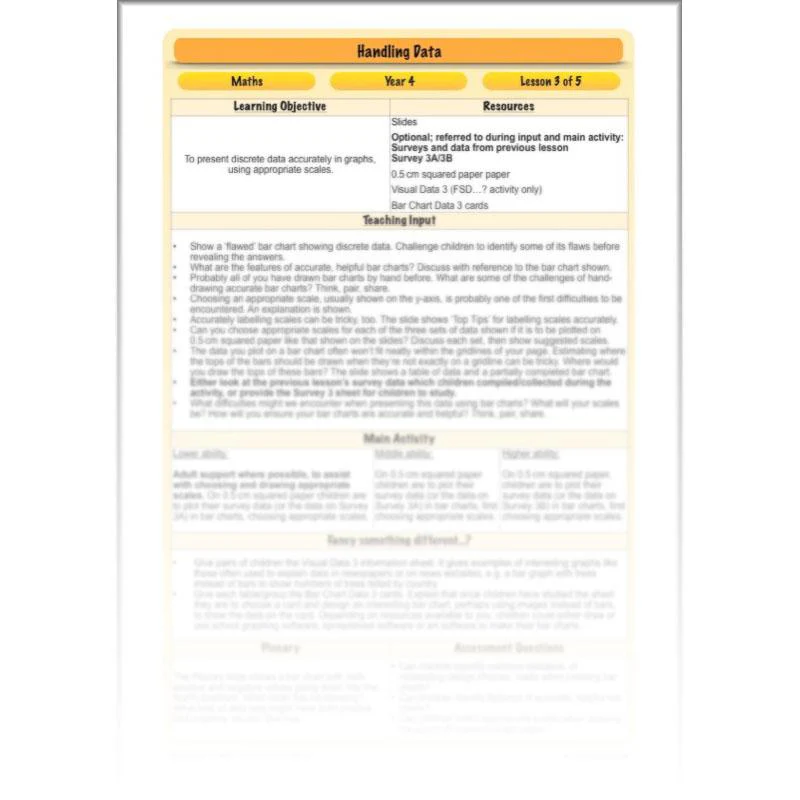
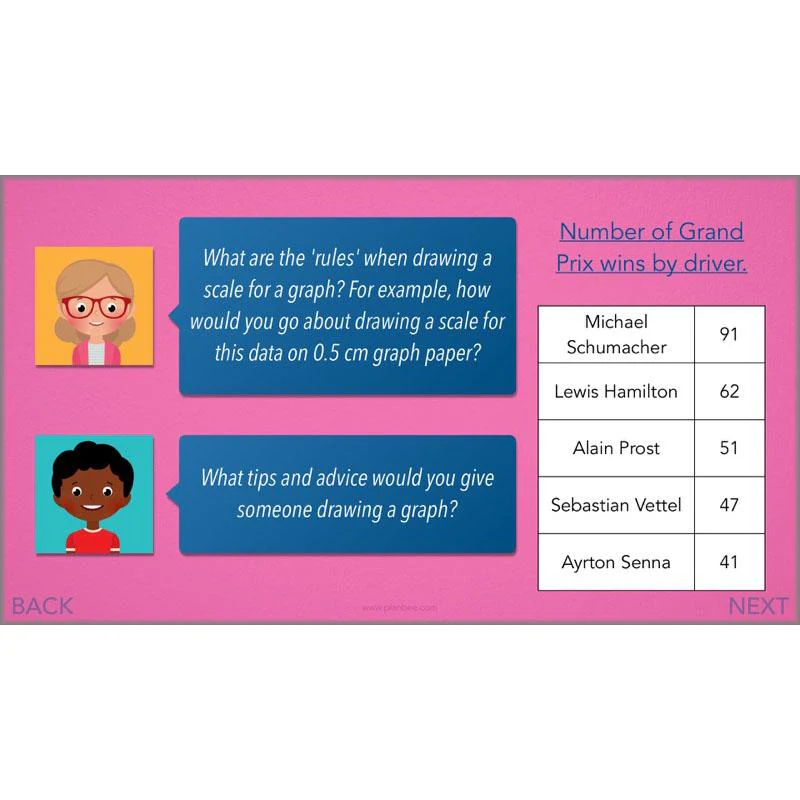
Kick things off by identifying some very common mistakes made when drawing bar charts, and how to avoid making them. After that, take a look at some strategies for drawing perhaps the trickiest part of a bar chart: the scale. Once you’ve gone through the slides and the included teaching input, there’s a choice of activities where children may present either given sets of data, or data they’ve collected through surveys they’ve done previously. There’s even an alternative activity where children are challenged to present interesting statistics using infographic-style bar charts with images.
This downloadable lesson comes with a lesson plan, a slideshow presentation and printable teaching resources.
What's included:
- Lesson plan
- Slides
- Activity ideas
- Survey data sheet
- Visual data sheet
- Bar chart data cards
BIG Data
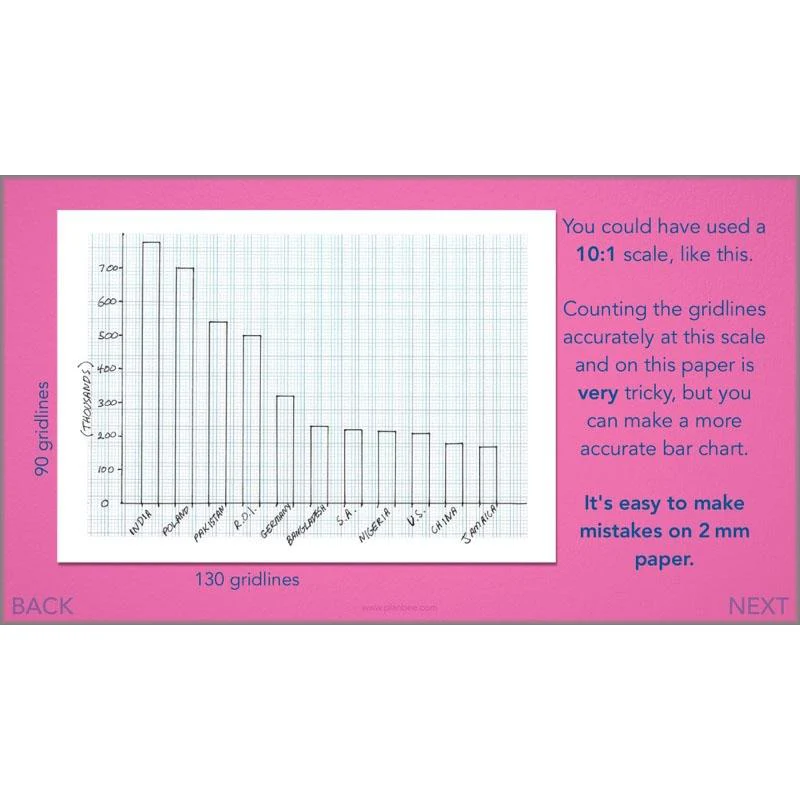
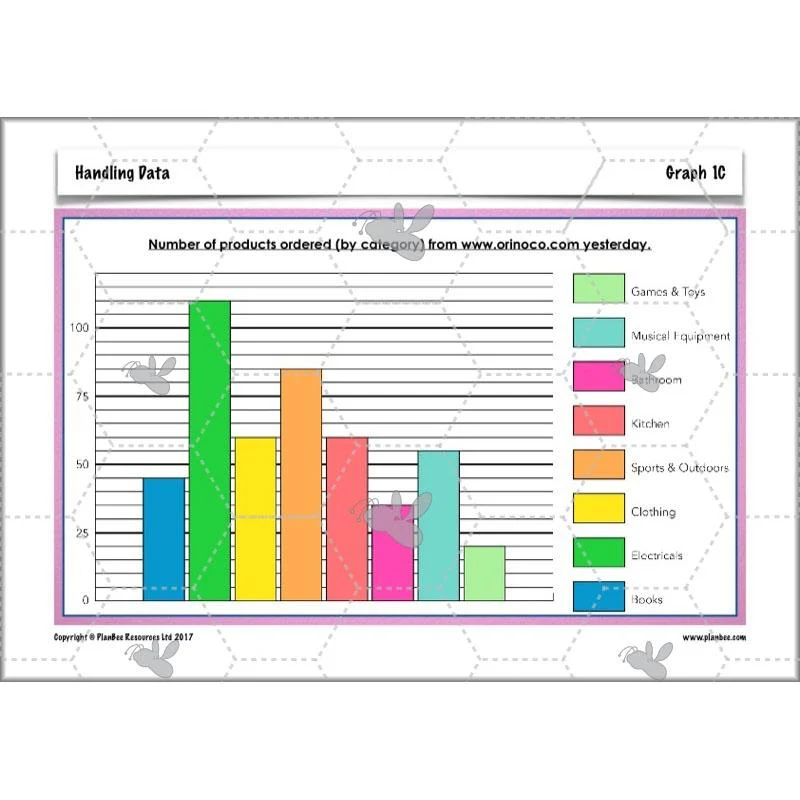
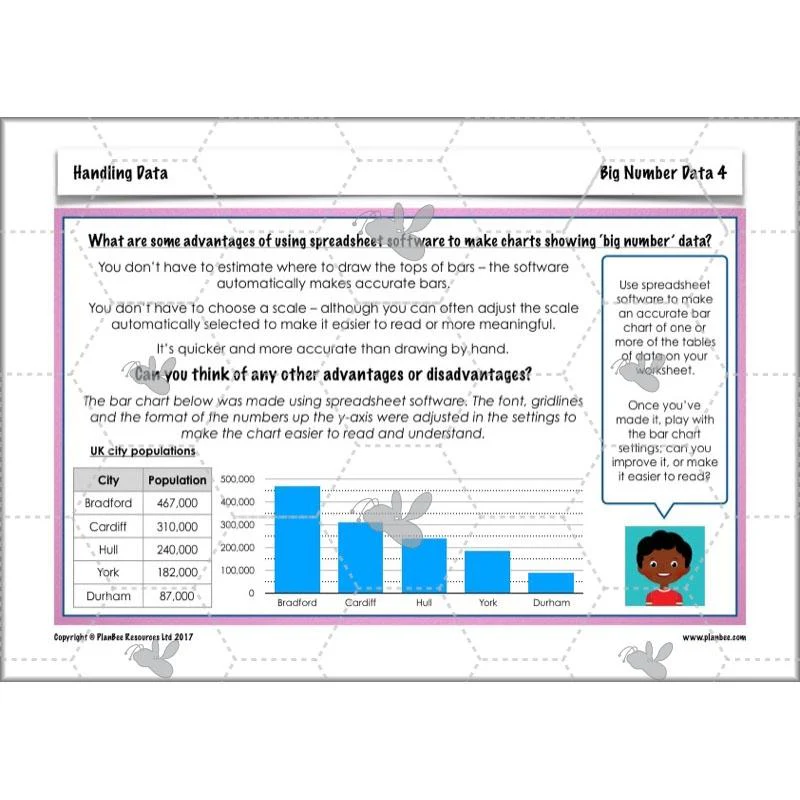
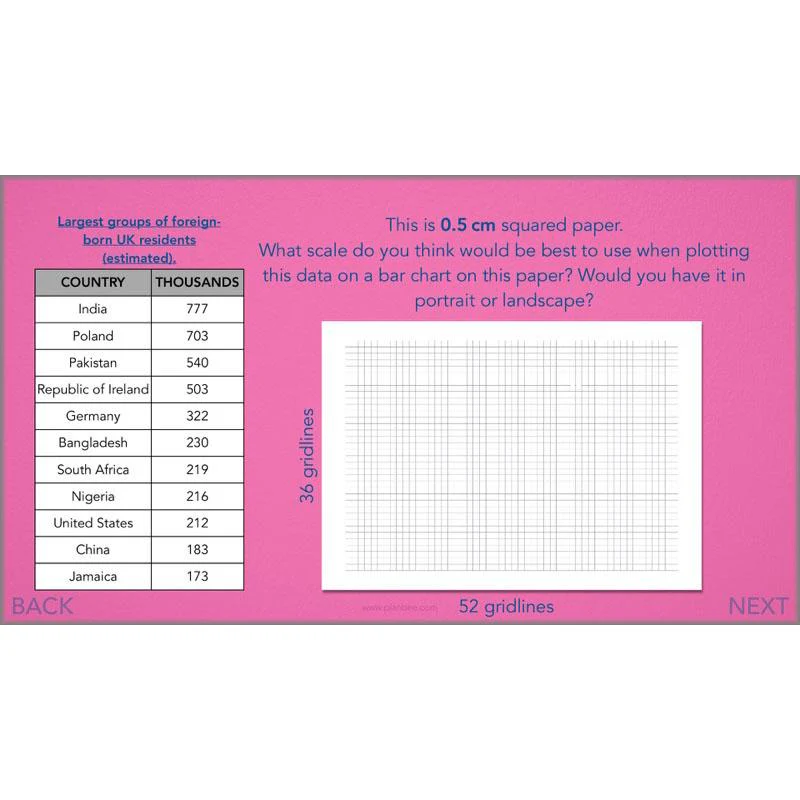
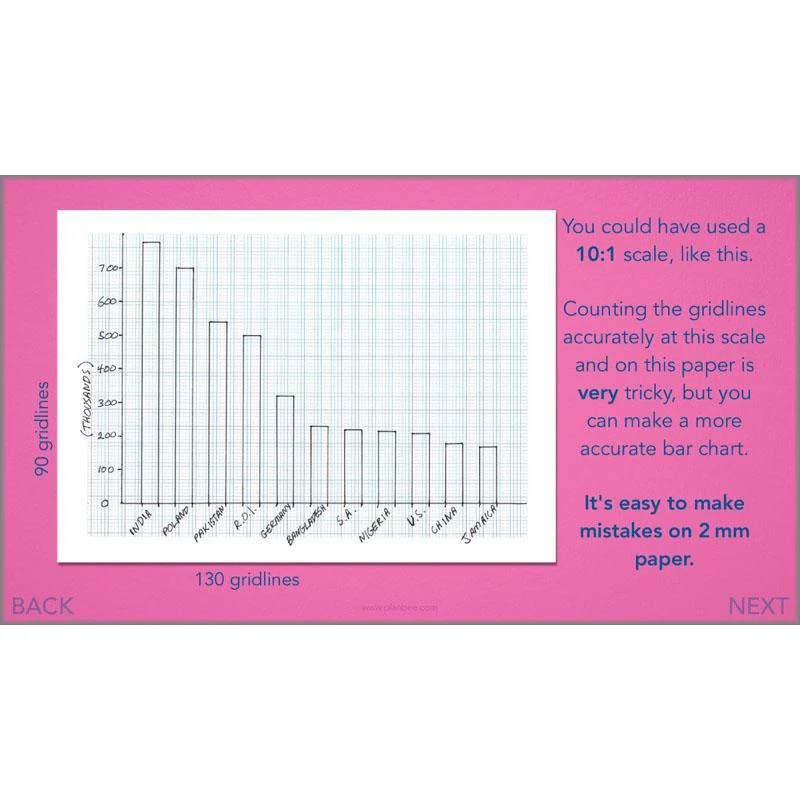
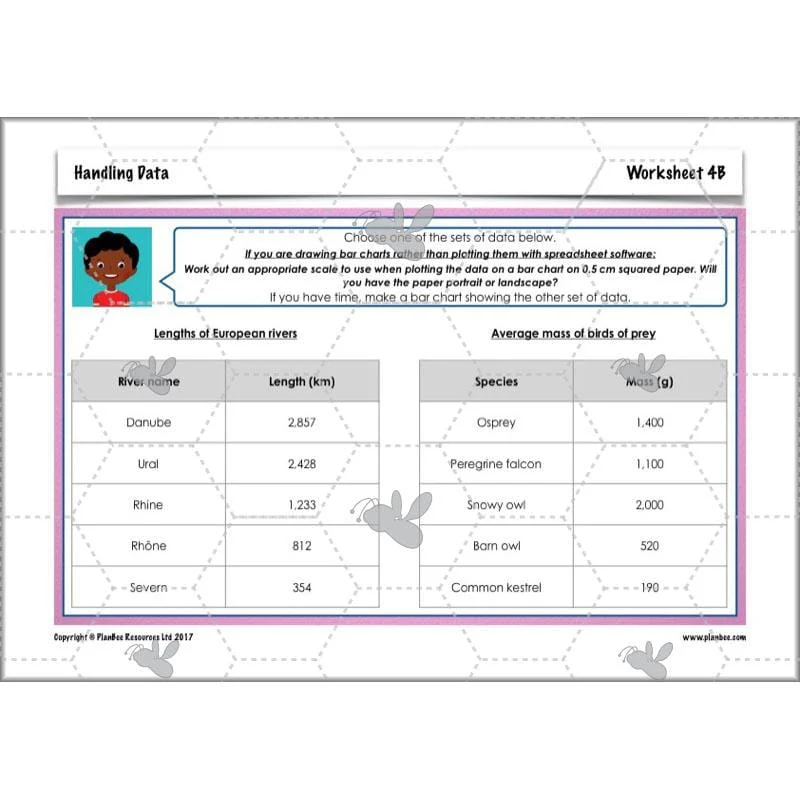
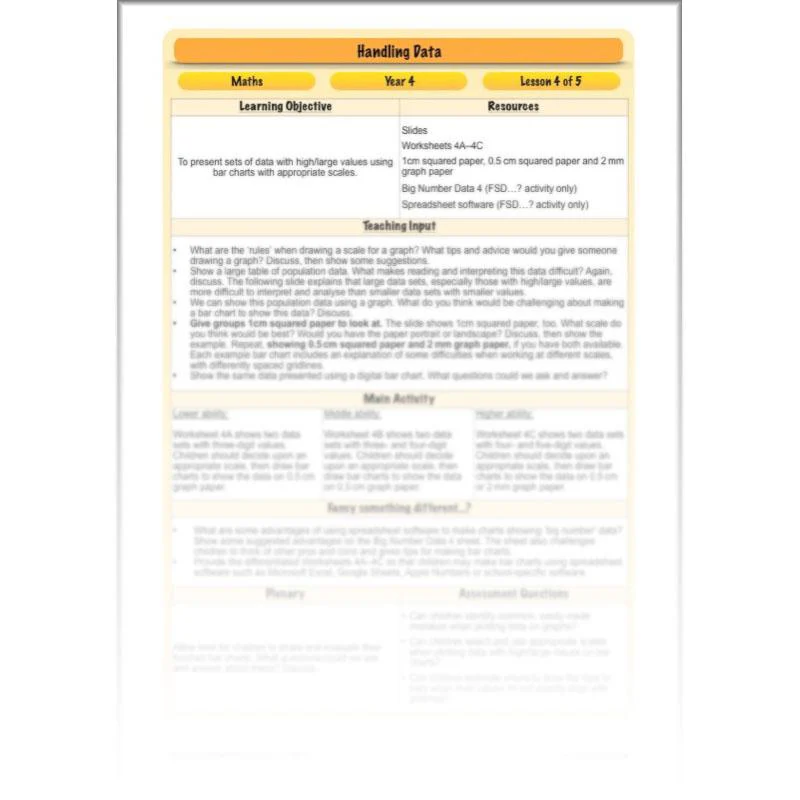
Whereas in previous lessons children produced bar charts using given, easy to plot sets of data, this lesson’s included input challenges children to think about some of the difficulties of plotting data sets with big numbers, or numbers with several decimal places. The complexities of selecting and using appropriate scales for this kind of data when drawing on squared paper or graph paper of different sizes are also explored. After that, there’s a choice of differentiated activities where children may either draw ‘big number’ bar charts, or explore the advantages and disadvantages of using spreadsheet software to record and plot data.
This downloadable lesson comes with a lesson plan, a slideshow presentation and printable teaching resources.
What's included:
- Lesson plan
- Slides
- Activity ideas
- Differentiated worksheets
- Big Number Data challenge card
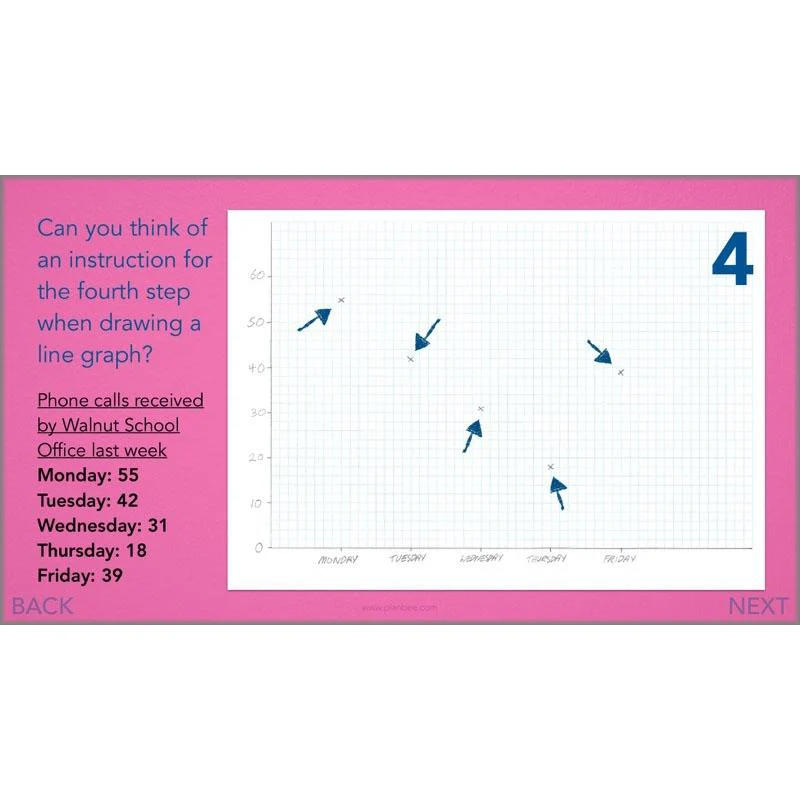
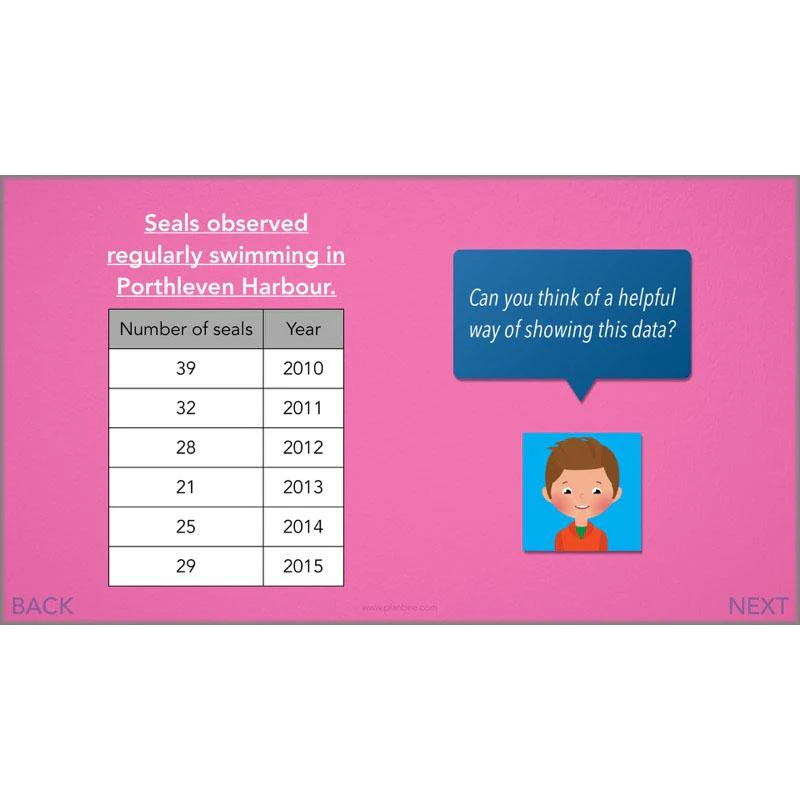
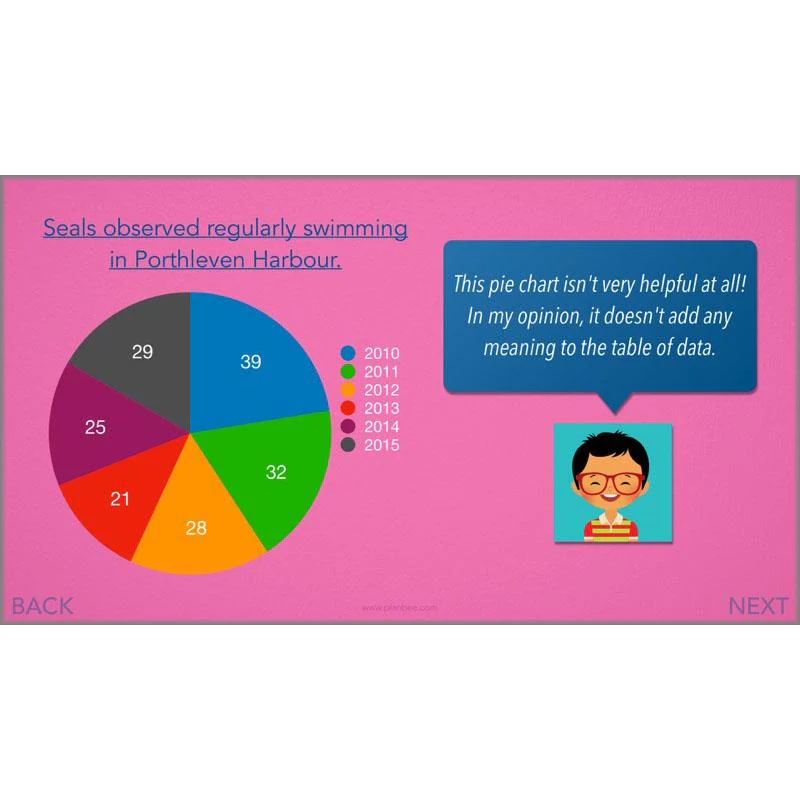
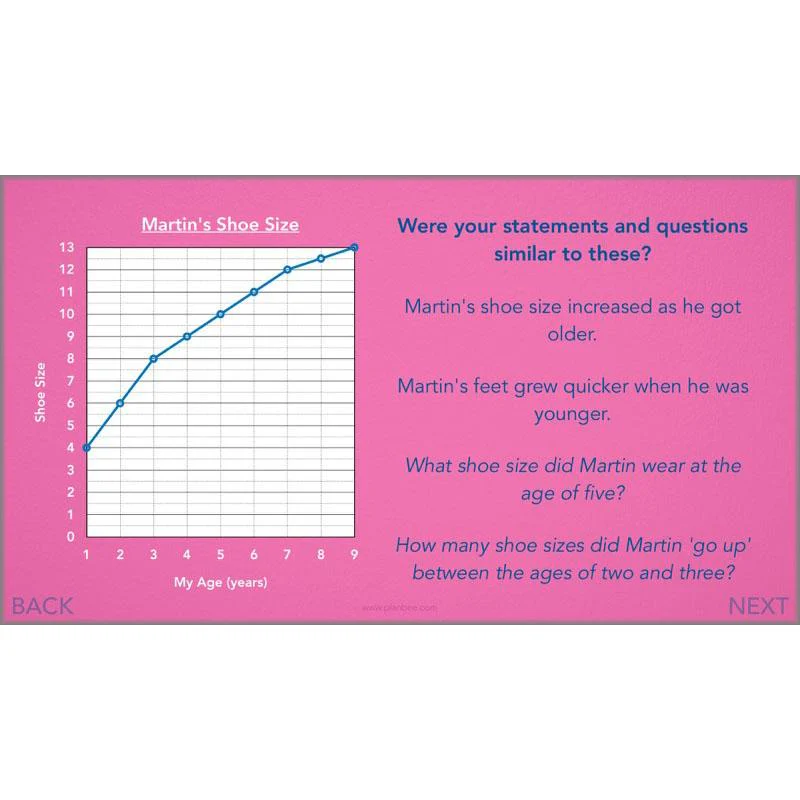
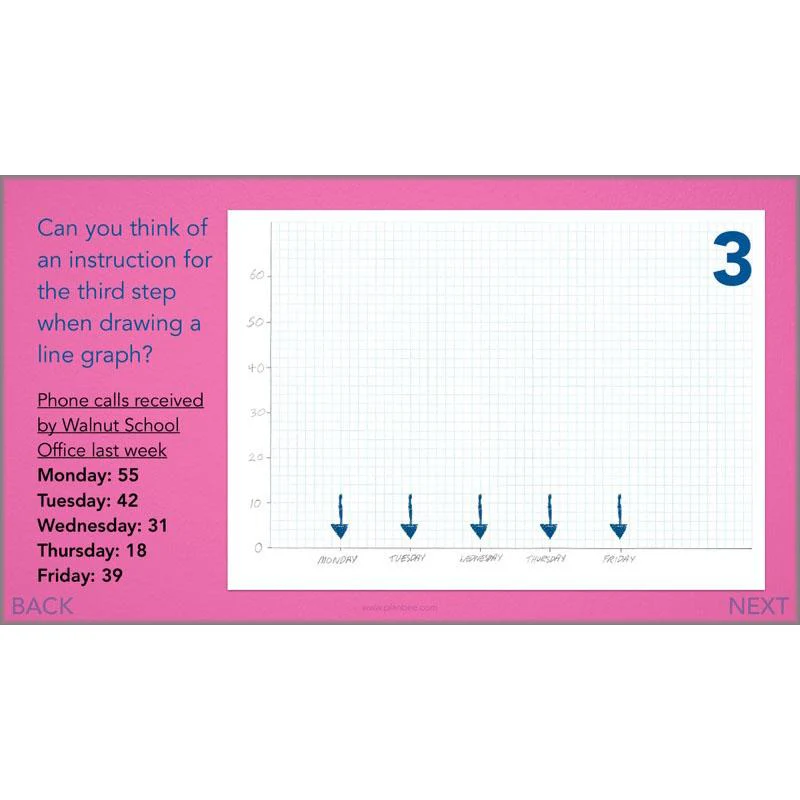
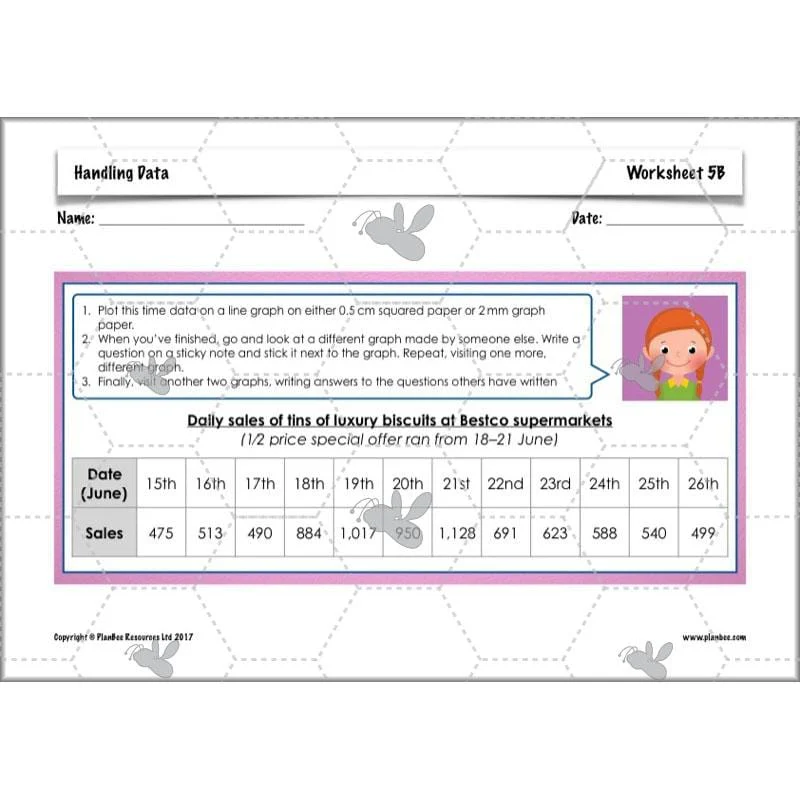
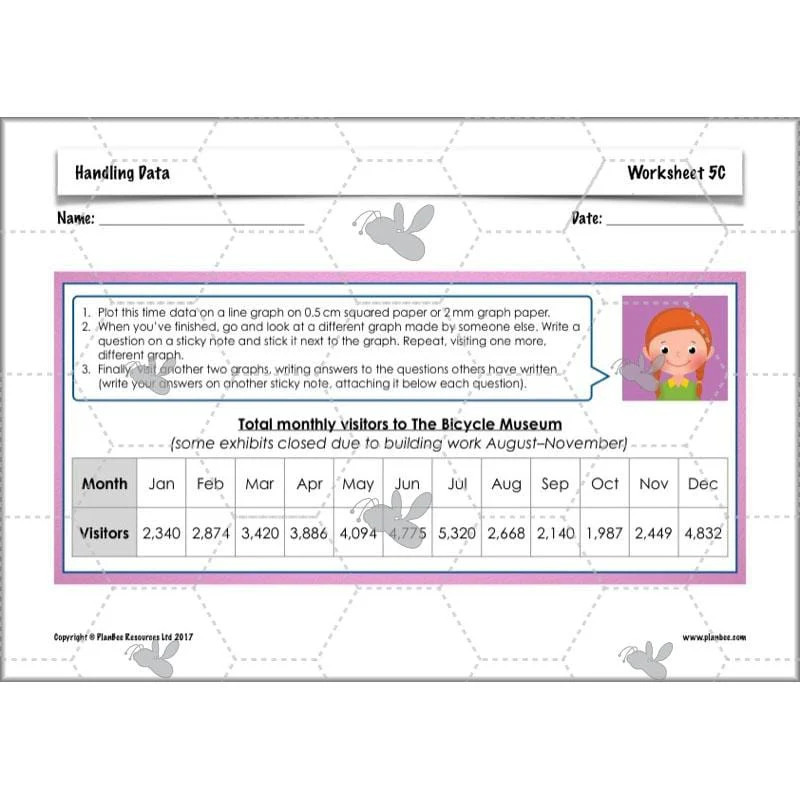
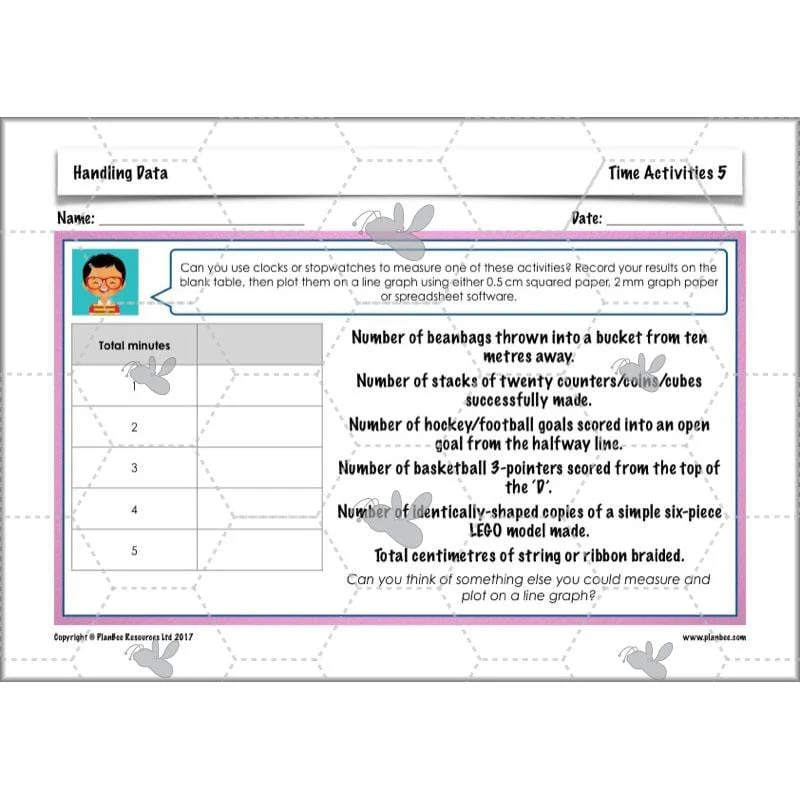
Time Data, Line Graphs
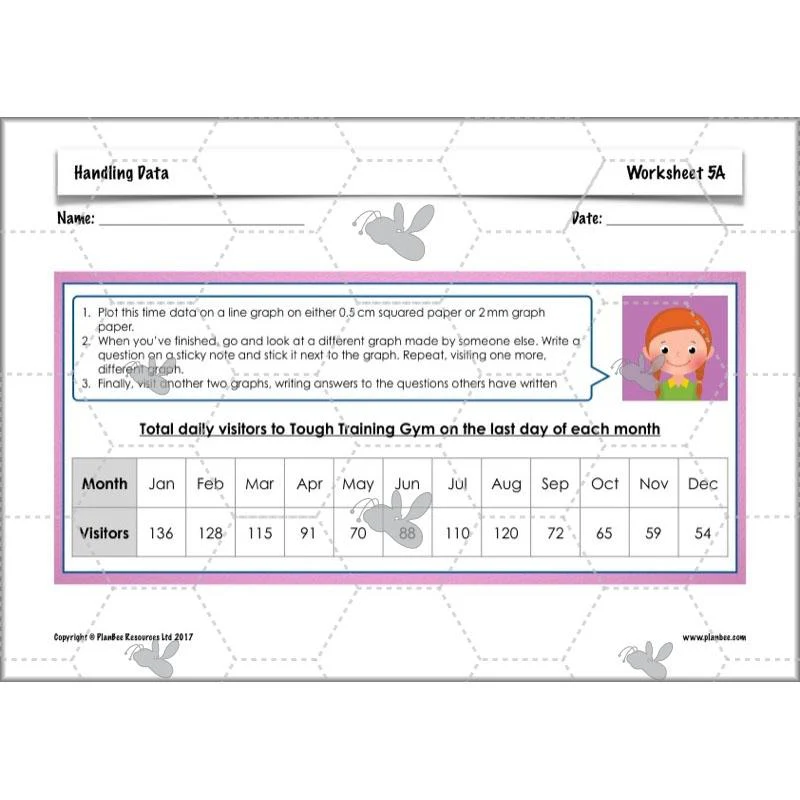
In this lesson, children will begin to consider how time data may be presented, and what types of graphs are most useful for presenting it. After that, they’ll learn how to plot simple sets of time data on line graphs, ensuring they understand first by writing their own graph-drawing instructions. After that there’s a choice of differentiated activities where children may either draw line graphs for given sets of data or collect and plot their own data.
This downloadable lesson comes with a lesson plan, a slideshow presentation and printable teaching resources.
What's included:
- Lesson plan
- Slides
- Activity ideas
- Differentiated worksheets
- Time Activities card
Original: $3.49
-70%$3.49
$1.05More Images


Handling Data
Move beyond the mechanics of making bar charts and line graphs, and focus on how they can be used to make meaning from sets of data, how they can show trends and help make predictions, and how selecting an appropriate style of graph is important when you’re trying to make a set of data easier to read and understand.
Kicking things off, the first lesson in this Complete Series briefly recaps features of bar charts, then challenges children to read and interpret them while writing and solving problems. After that, the scope of these Year 4 Maths lessons widens, exploring ways of designing and conducting effective surveys, avoiding common mistakes when drawing or reading graphs – both when drawing them on paper and when using spreadsheet software, working with ‘big’ numbers, and even making and using stacked bar charts and line graphs to show time data.
There’s heaps of printable resources included with these five lessons, designed to help your class access the learning and work increasingly independently. As always, the plans include a choice of well-differentiated activities. If you’re looking to help your children make progress with their statistics learning as they move into upper Key Stage 2, these lessons are probably just what you need!
Reading Bar Charts
Briefly recap features of bar charts, then challenge children to mentally solve problems by reading and interpreting data given in bar charts. As they become increasingly competent doing so, next challenge them to write and improve problems of their own which may be solved by interpreting data in graphs. After that there’s a choice of two, differentiated activities where children can ask and answer challenging questions about bar charts displayed around the room.
This downloadable lesson comes with a lesson plan, a slideshow presentation and printable teaching resources.
What's included:
- Lesson plan
- Slides
- Activity ideas
- Graphs
- Question cards
- Quiz sheet
- Answer sheet
Planning Surveys
Challenge children to consider how surveys are conducted and what makes a ‘good’ survey question. The included slides explain why survey questions must have multiple-choice questions if they are to be presented and interpreted using graphs, and challenge children to consider if and when having ‘other’ or ‘nothing’ answer choices may be appropriate.
After that, there’s a choice of differentiated activities for your class to tackle, where they’ll either devise survey questionnaires for a given scenario or choose one of their own.
This downloadable lesson comes with a lesson plan, a slideshow presentation and printable teaching resources.
What's included:
- Lesson plan
- Slides
- Activity ideas
- Example questions sheet
- Differentiated worksheets
- Survey ideas sheet
Presenting Survey Data
Kick things off by identifying some very common mistakes made when drawing bar charts, and how to avoid making them. After that, take a look at some strategies for drawing perhaps the trickiest part of a bar chart: the scale. Once you’ve gone through the slides and the included teaching input, there’s a choice of activities where children may present either given sets of data, or data they’ve collected through surveys they’ve done previously. There’s even an alternative activity where children are challenged to present interesting statistics using infographic-style bar charts with images.
This downloadable lesson comes with a lesson plan, a slideshow presentation and printable teaching resources.
What's included:
- Lesson plan
- Slides
- Activity ideas
- Survey data sheet
- Visual data sheet
- Bar chart data cards
BIG Data
Whereas in previous lessons children produced bar charts using given, easy to plot sets of data, this lesson’s included input challenges children to think about some of the difficulties of plotting data sets with big numbers, or numbers with several decimal places. The complexities of selecting and using appropriate scales for this kind of data when drawing on squared paper or graph paper of different sizes are also explored. After that, there’s a choice of differentiated activities where children may either draw ‘big number’ bar charts, or explore the advantages and disadvantages of using spreadsheet software to record and plot data.
This downloadable lesson comes with a lesson plan, a slideshow presentation and printable teaching resources.
What's included:
- Lesson plan
- Slides
- Activity ideas
- Differentiated worksheets
- Big Number Data challenge card
Time Data, Line Graphs
In this lesson, children will begin to consider how time data may be presented, and what types of graphs are most useful for presenting it. After that, they’ll learn how to plot simple sets of time data on line graphs, ensuring they understand first by writing their own graph-drawing instructions. After that there’s a choice of differentiated activities where children may either draw line graphs for given sets of data or collect and plot their own data.
This downloadable lesson comes with a lesson plan, a slideshow presentation and printable teaching resources.
What's included:
- Lesson plan
- Slides
- Activity ideas
- Differentiated worksheets
- Time Activities card
Product Information
Product Information
Shipping & Returns
Shipping & Returns
Description
Move beyond the mechanics of making bar charts and line graphs, and focus on how they can be used to make meaning from sets of data, how they can show trends and help make predictions, and how selecting an appropriate style of graph is important when you’re trying to make a set of data easier to read and understand.
Kicking things off, the first lesson in this Complete Series briefly recaps features of bar charts, then challenges children to read and interpret them while writing and solving problems. After that, the scope of these Year 4 Maths lessons widens, exploring ways of designing and conducting effective surveys, avoiding common mistakes when drawing or reading graphs – both when drawing them on paper and when using spreadsheet software, working with ‘big’ numbers, and even making and using stacked bar charts and line graphs to show time data.
There’s heaps of printable resources included with these five lessons, designed to help your class access the learning and work increasingly independently. As always, the plans include a choice of well-differentiated activities. If you’re looking to help your children make progress with their statistics learning as they move into upper Key Stage 2, these lessons are probably just what you need!
Reading Bar Charts
Briefly recap features of bar charts, then challenge children to mentally solve problems by reading and interpreting data given in bar charts. As they become increasingly competent doing so, next challenge them to write and improve problems of their own which may be solved by interpreting data in graphs. After that there’s a choice of two, differentiated activities where children can ask and answer challenging questions about bar charts displayed around the room.
This downloadable lesson comes with a lesson plan, a slideshow presentation and printable teaching resources.
What's included:
- Lesson plan
- Slides
- Activity ideas
- Graphs
- Question cards
- Quiz sheet
- Answer sheet
Planning Surveys
Challenge children to consider how surveys are conducted and what makes a ‘good’ survey question. The included slides explain why survey questions must have multiple-choice questions if they are to be presented and interpreted using graphs, and challenge children to consider if and when having ‘other’ or ‘nothing’ answer choices may be appropriate.
After that, there’s a choice of differentiated activities for your class to tackle, where they’ll either devise survey questionnaires for a given scenario or choose one of their own.
This downloadable lesson comes with a lesson plan, a slideshow presentation and printable teaching resources.
What's included:
- Lesson plan
- Slides
- Activity ideas
- Example questions sheet
- Differentiated worksheets
- Survey ideas sheet
Presenting Survey Data
Kick things off by identifying some very common mistakes made when drawing bar charts, and how to avoid making them. After that, take a look at some strategies for drawing perhaps the trickiest part of a bar chart: the scale. Once you’ve gone through the slides and the included teaching input, there’s a choice of activities where children may present either given sets of data, or data they’ve collected through surveys they’ve done previously. There’s even an alternative activity where children are challenged to present interesting statistics using infographic-style bar charts with images.
This downloadable lesson comes with a lesson plan, a slideshow presentation and printable teaching resources.
What's included:
- Lesson plan
- Slides
- Activity ideas
- Survey data sheet
- Visual data sheet
- Bar chart data cards
BIG Data
Whereas in previous lessons children produced bar charts using given, easy to plot sets of data, this lesson’s included input challenges children to think about some of the difficulties of plotting data sets with big numbers, or numbers with several decimal places. The complexities of selecting and using appropriate scales for this kind of data when drawing on squared paper or graph paper of different sizes are also explored. After that, there’s a choice of differentiated activities where children may either draw ‘big number’ bar charts, or explore the advantages and disadvantages of using spreadsheet software to record and plot data.
This downloadable lesson comes with a lesson plan, a slideshow presentation and printable teaching resources.
What's included:
- Lesson plan
- Slides
- Activity ideas
- Differentiated worksheets
- Big Number Data challenge card
Time Data, Line Graphs
In this lesson, children will begin to consider how time data may be presented, and what types of graphs are most useful for presenting it. After that, they’ll learn how to plot simple sets of time data on line graphs, ensuring they understand first by writing their own graph-drawing instructions. After that there’s a choice of differentiated activities where children may either draw line graphs for given sets of data or collect and plot their own data.
This downloadable lesson comes with a lesson plan, a slideshow presentation and printable teaching resources.
What's included:
- Lesson plan
- Slides
- Activity ideas
- Differentiated worksheets
- Time Activities card