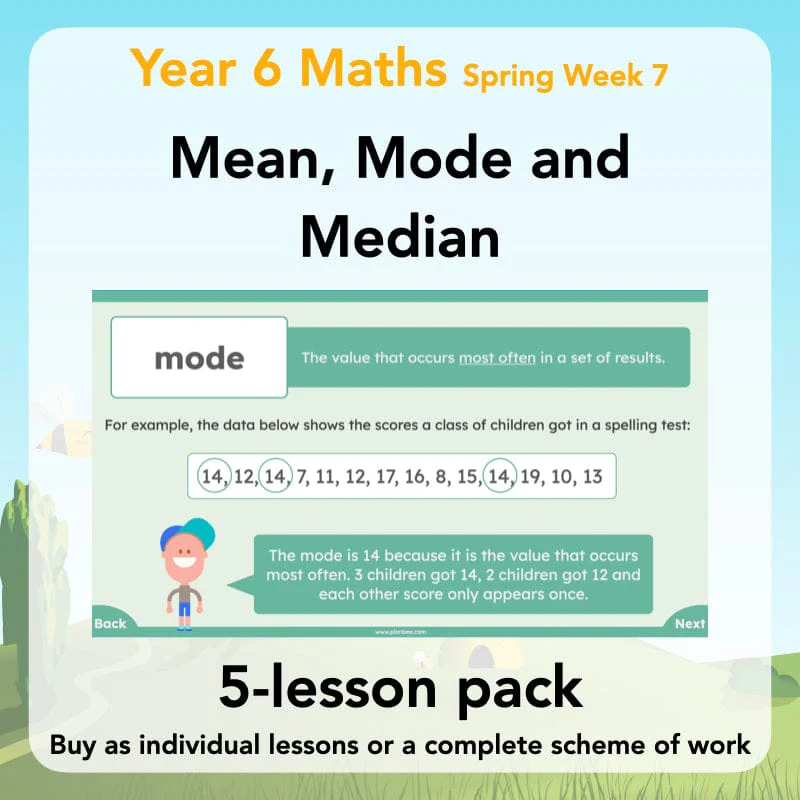
Mean, Mode and Median
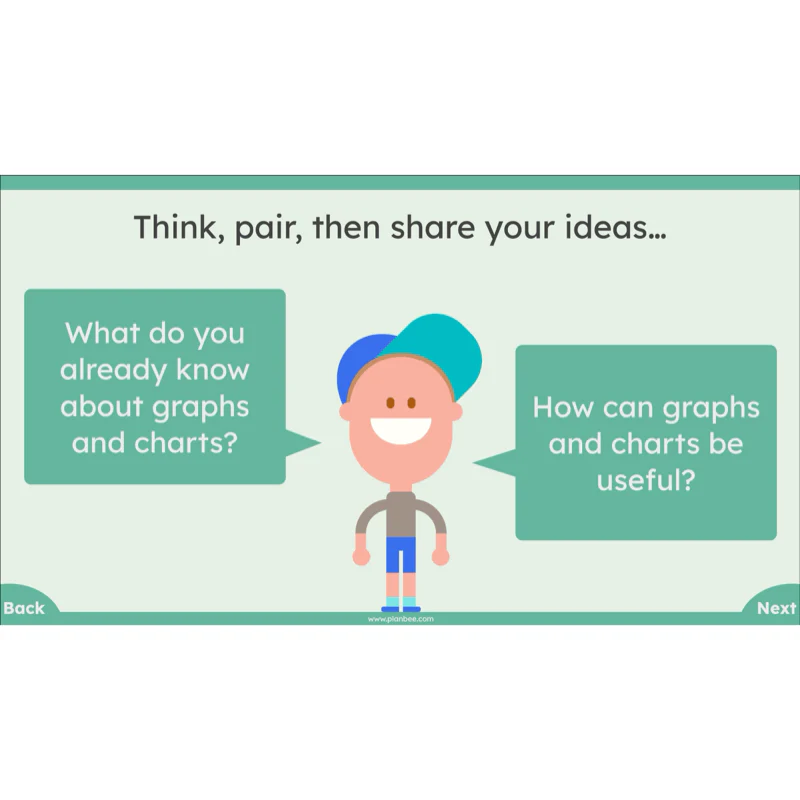
Teach your class to be dynamic data handlers! These lessons build on your children’s growing knowledge of charts, graphs and interpreting data by recapping the features of bar charts and line graphs, then challenging them to plot multiple sets of data as well as write and answer questions. Following on from this, children can tuck into some pie charts, learning how to read and interpret them as well as beginning to learn how to make them. As if that wasn’t enough, they’ll also consider different ways in which data can be gathered, sorted and interpreted by finding the mean, mode or median in given sets of data, and looking at how we can predict outcomes of events by considering their likelihood.
This downloadable series of lessons comes with detailed lesson plans, engaging slideshow presentations and printable teaching resources.
Graphs and Charts
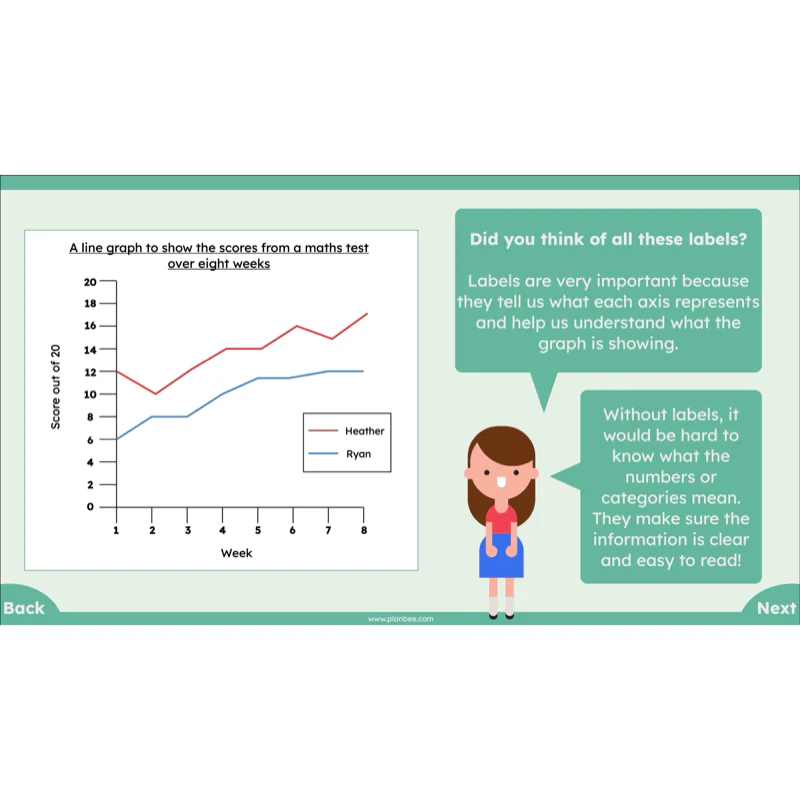
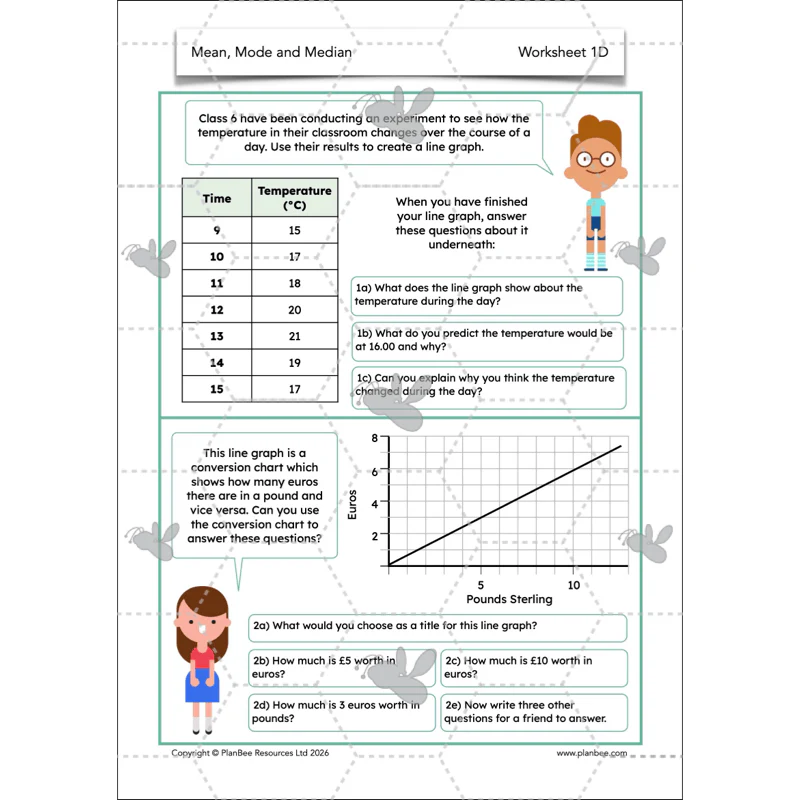
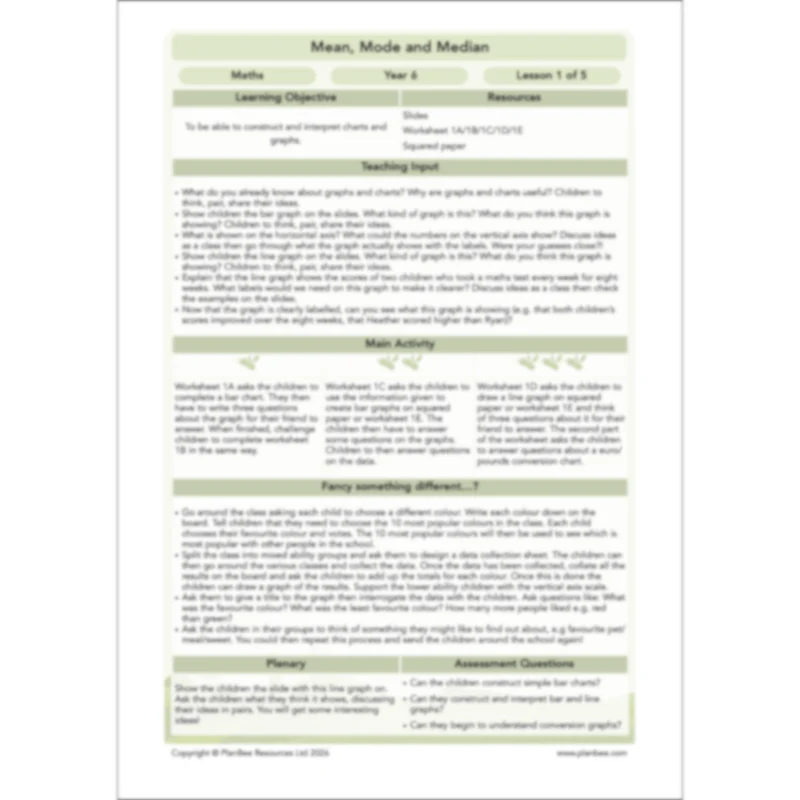
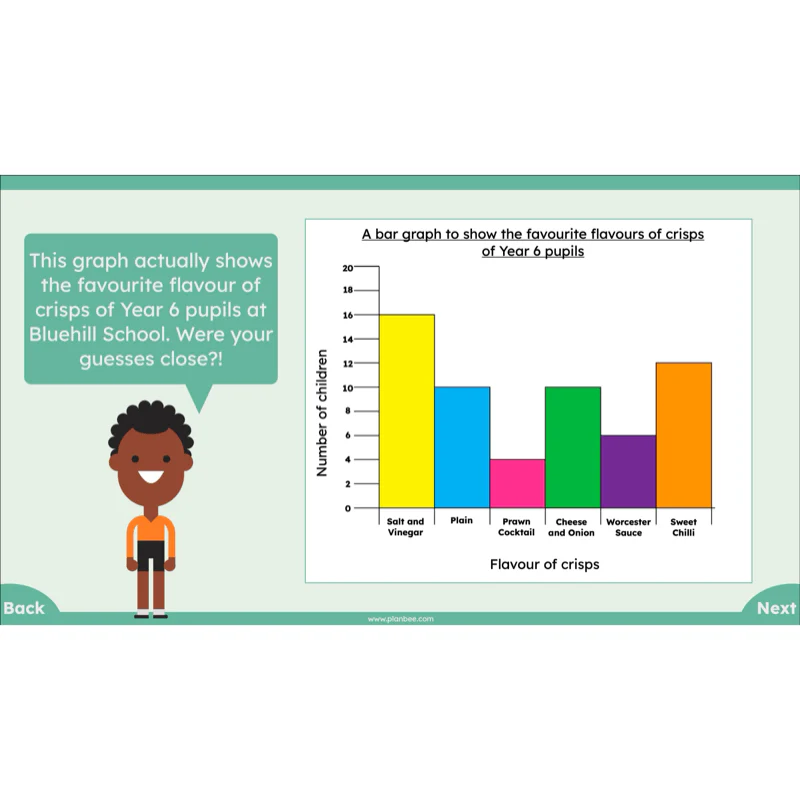
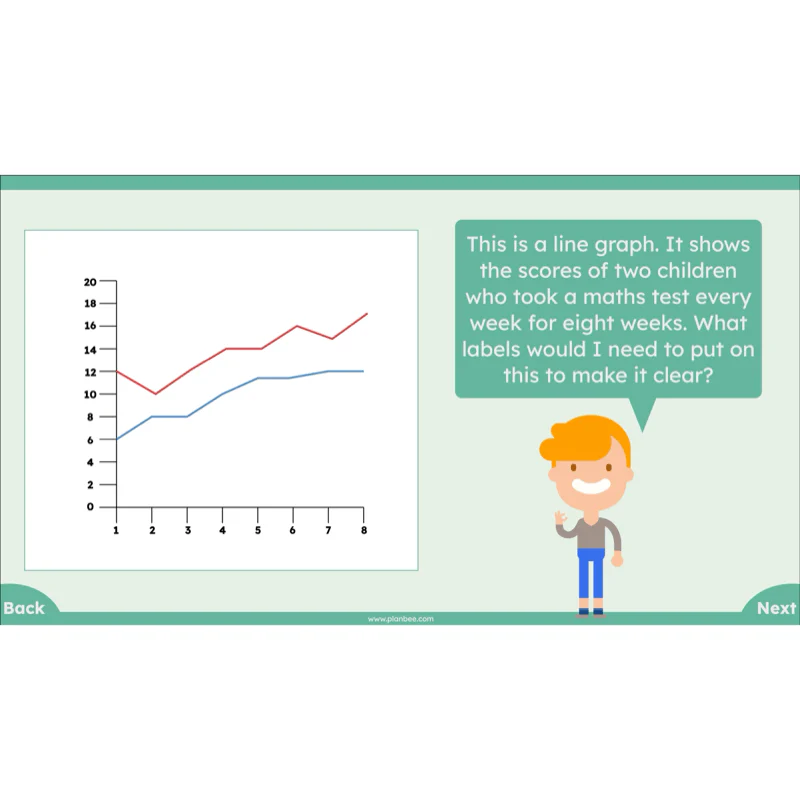
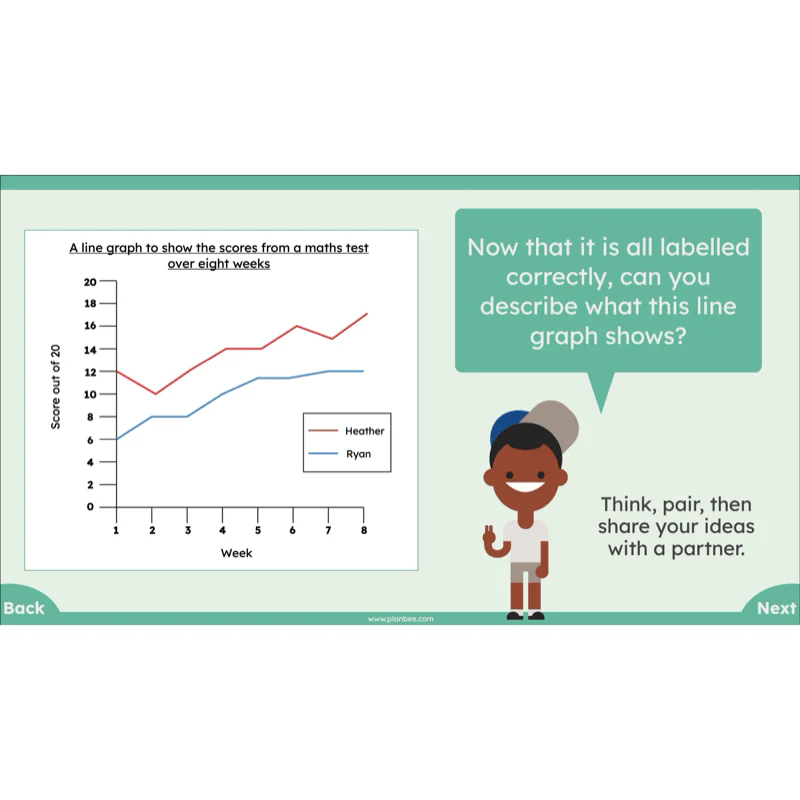
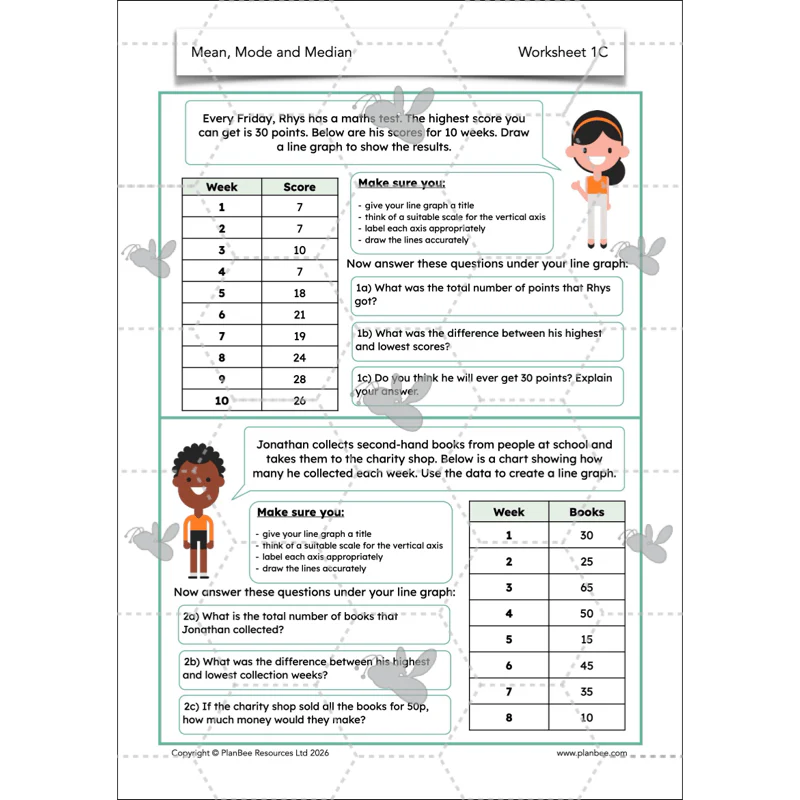
Recap the features of bar charts and line graphs, then challenge children to read and interpret information shown using them. Following this, children may practise drawing line graphs showing two or more sets of data, then ask and answer questions about the data shown.
This downloadable lesson includes a lesson plan, slideshow presentation and printable teaching resources.
What's included:
- Lesson plan
- Slides
- Activity ideas
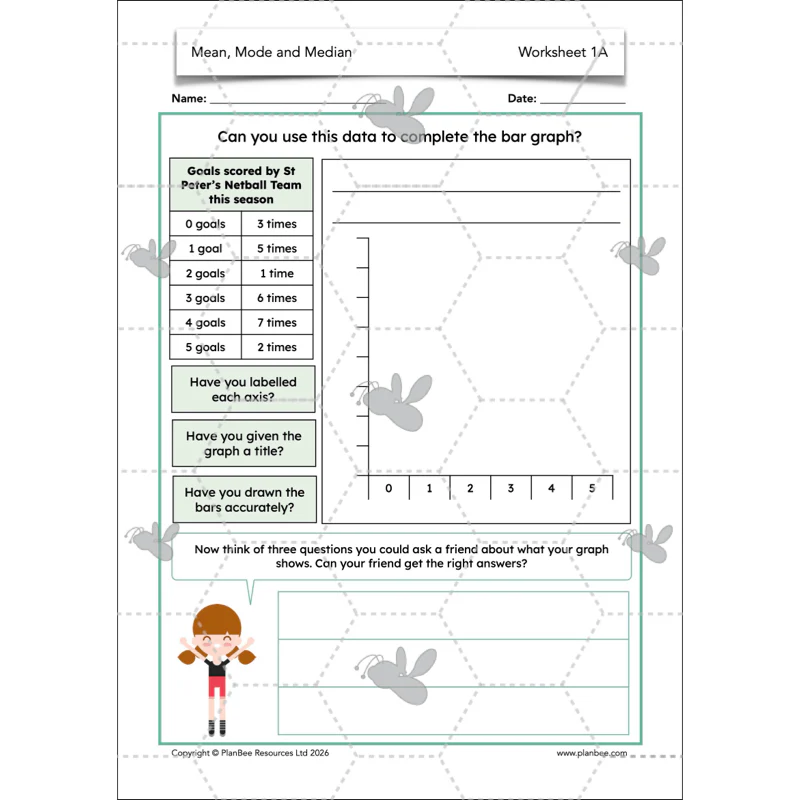
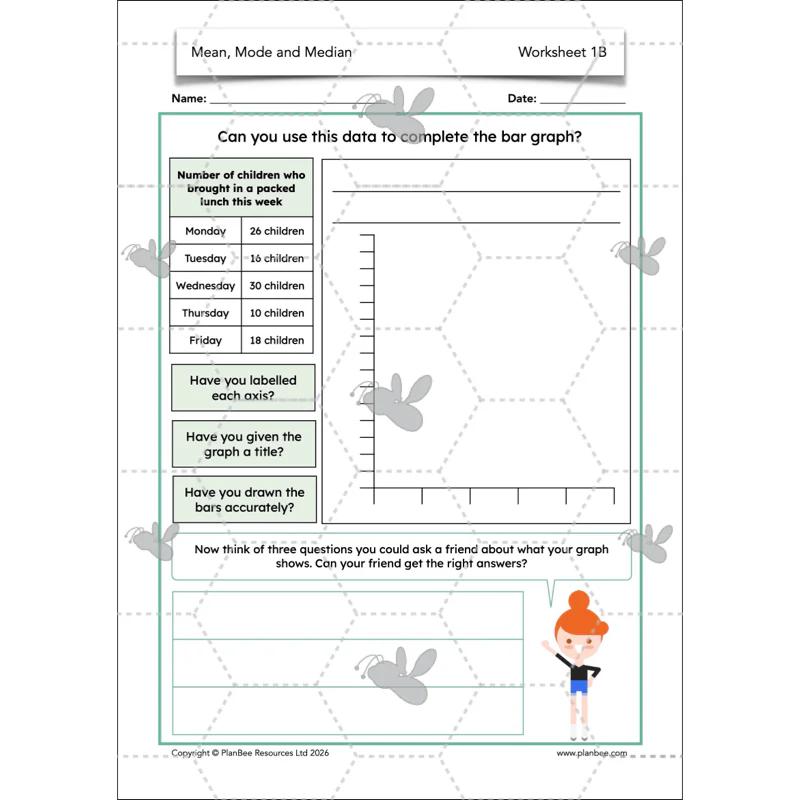
- Differentiated worksheets
- Squared paper
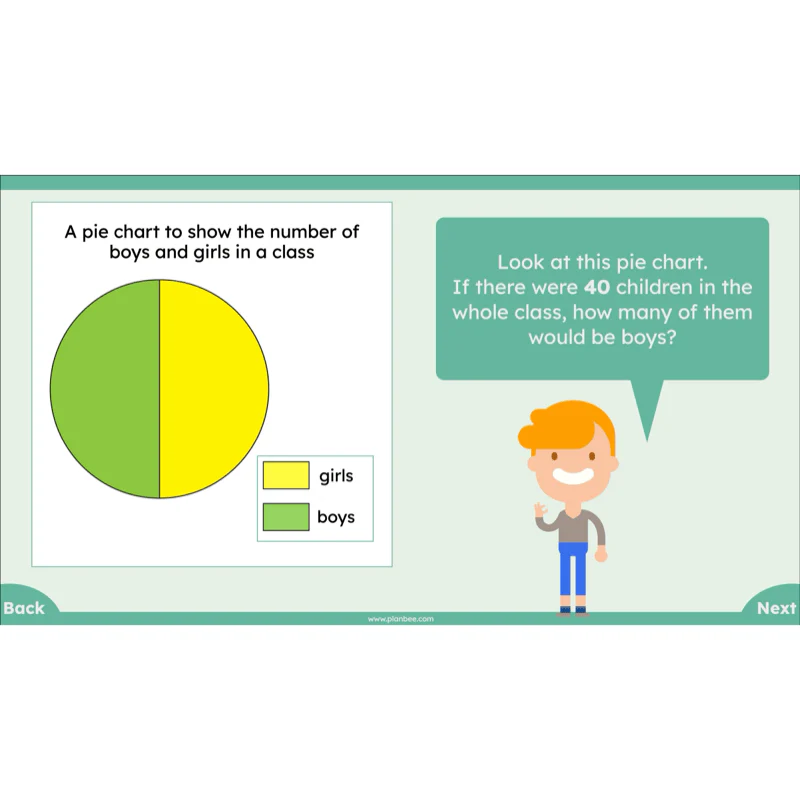
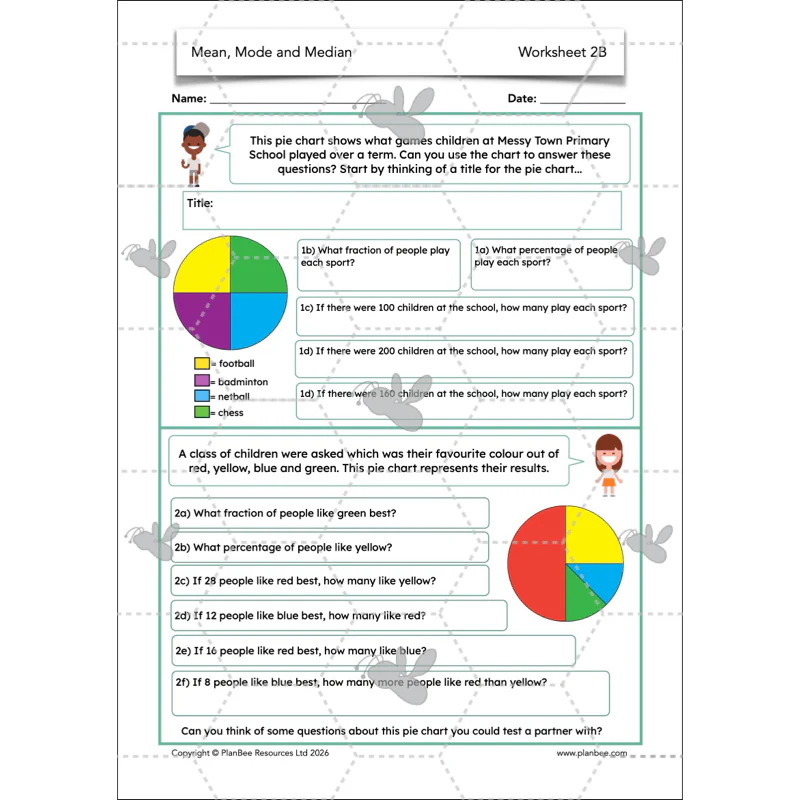
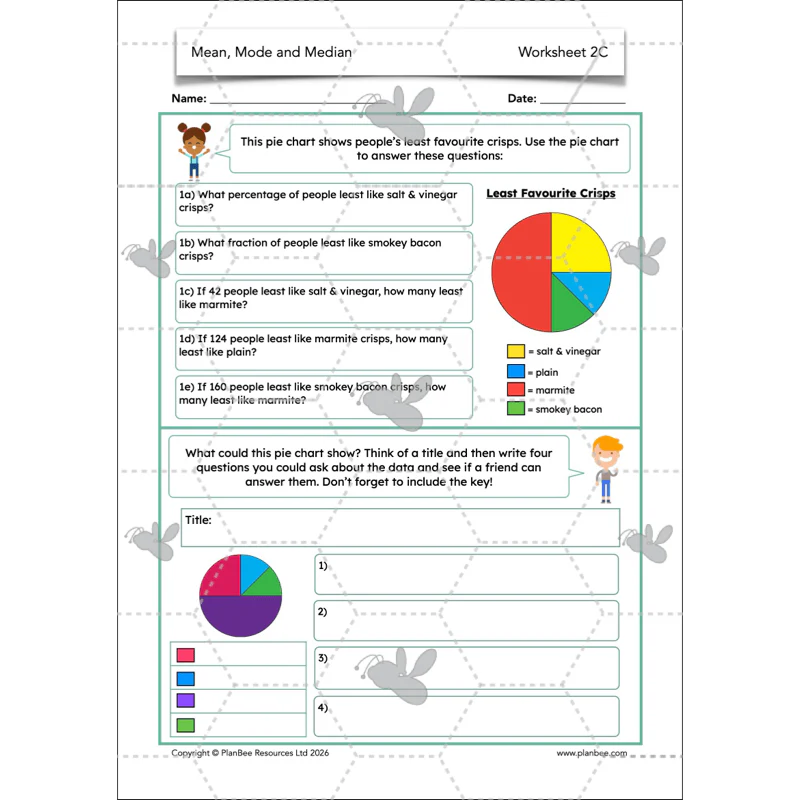
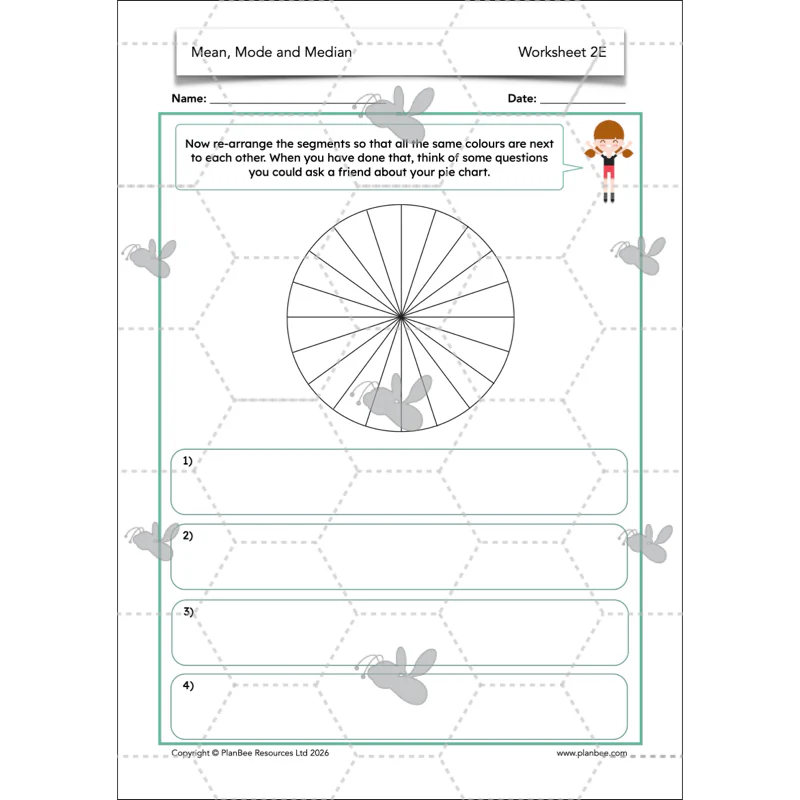
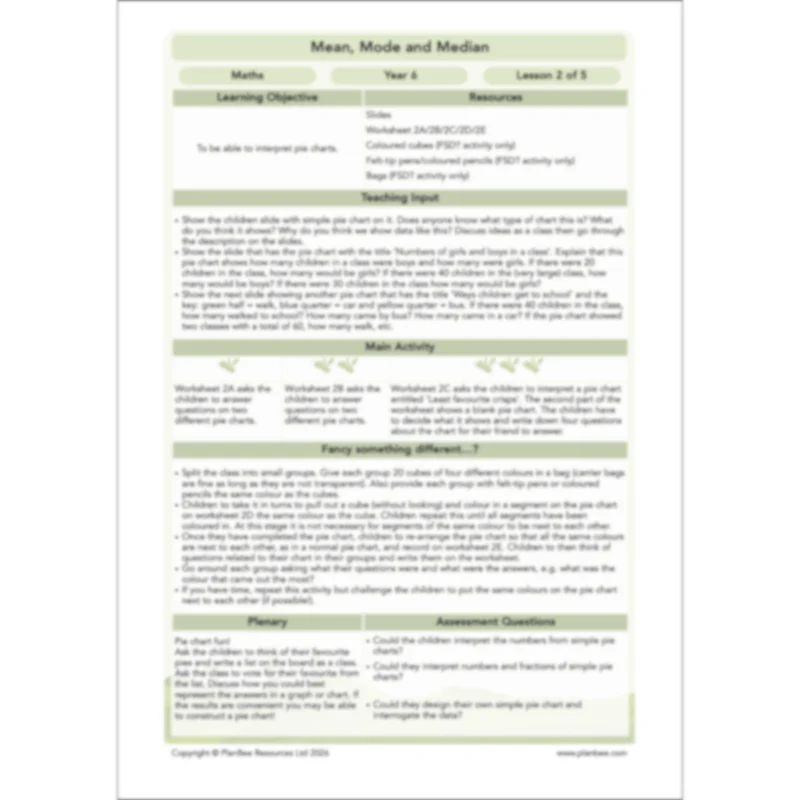
Pie Charts
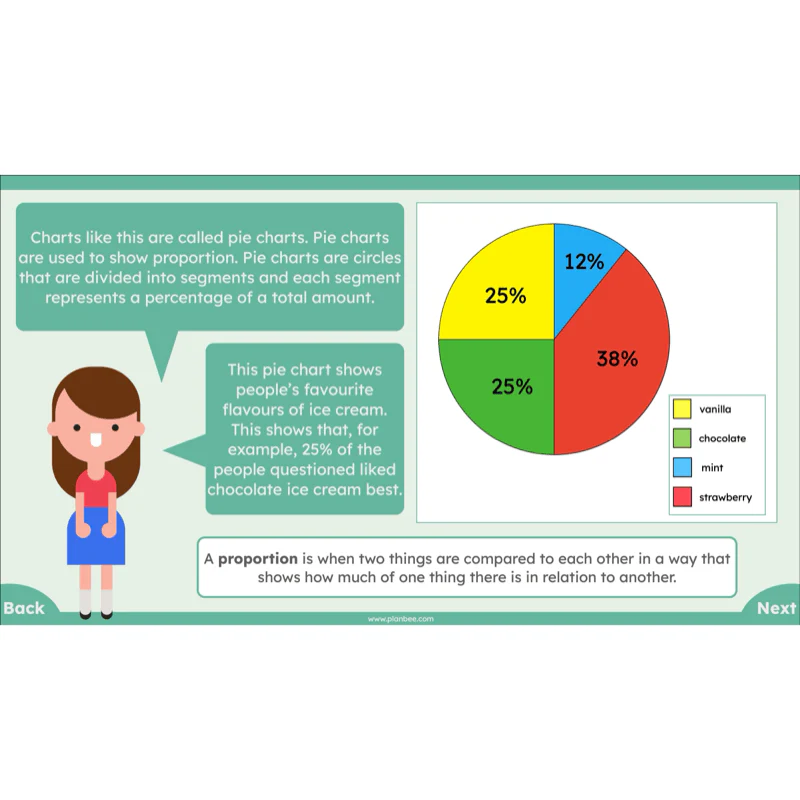
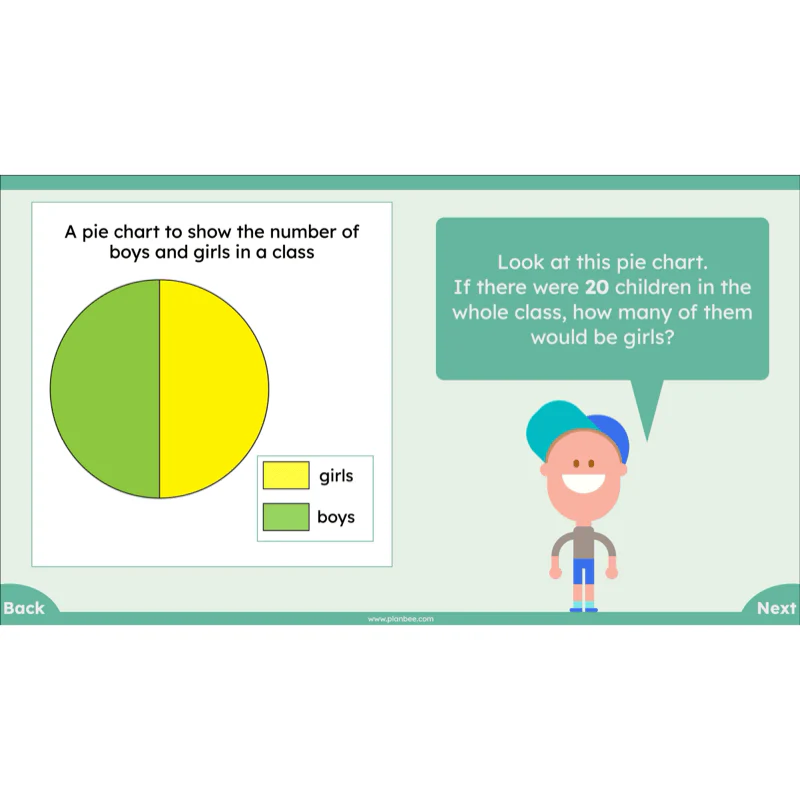
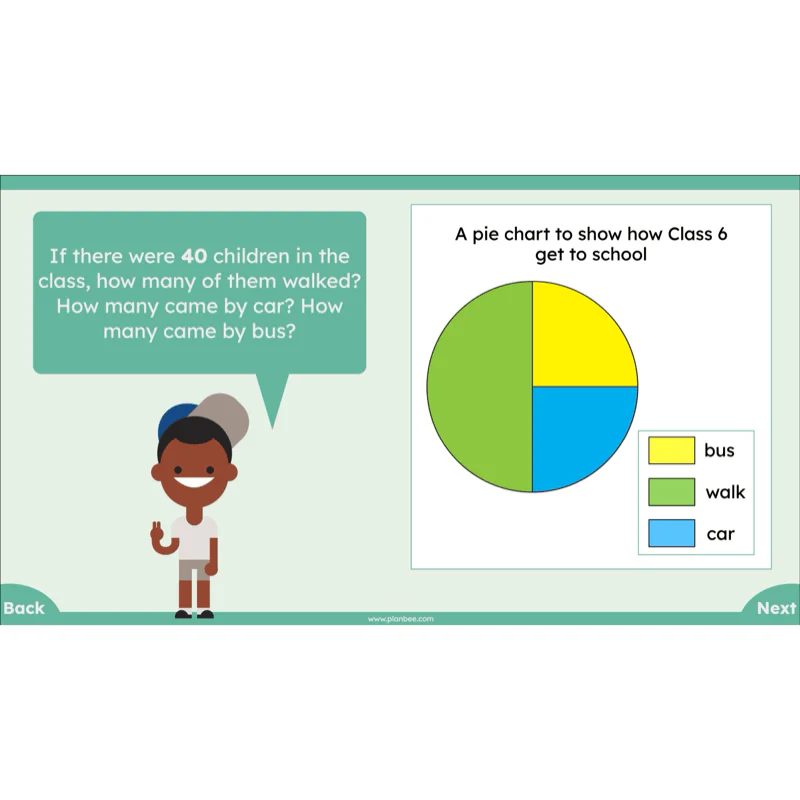
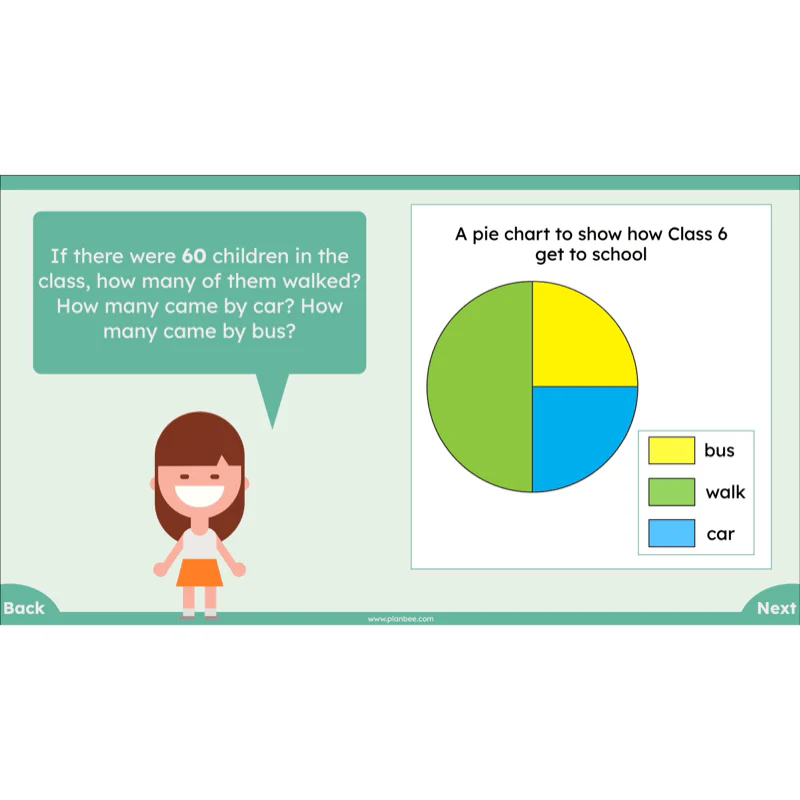
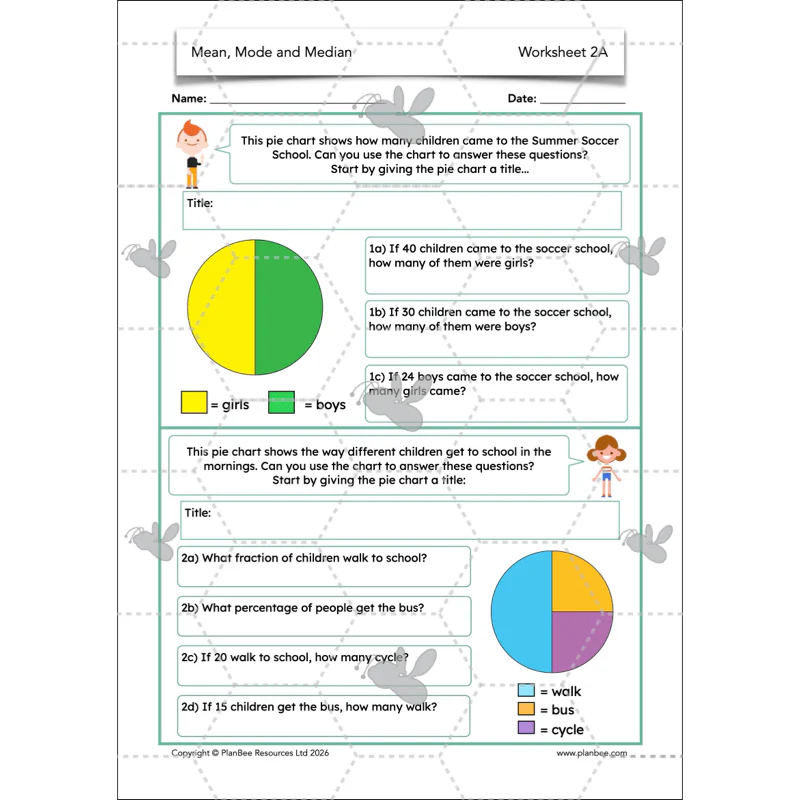
The included slides with this lesson describe the features of pie charts, then ask children to read and interpret data presented in them. Following this, either challenge children to ask and answer their own questions about data in pie charts, or undertake group activities where children will draw their own simple pie charts.
This downloadable lesson includes a lesson plan, slideshow presentation and printable teaching resources.
What's included:
- Lesson plan
- Slides
- Activity ideas
- Differentiated worksheets
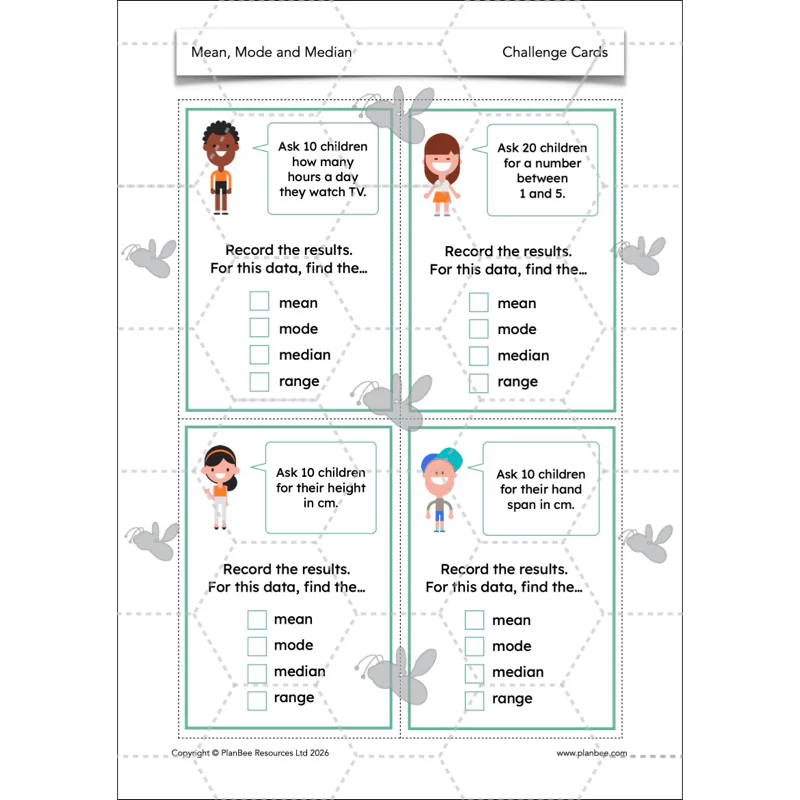
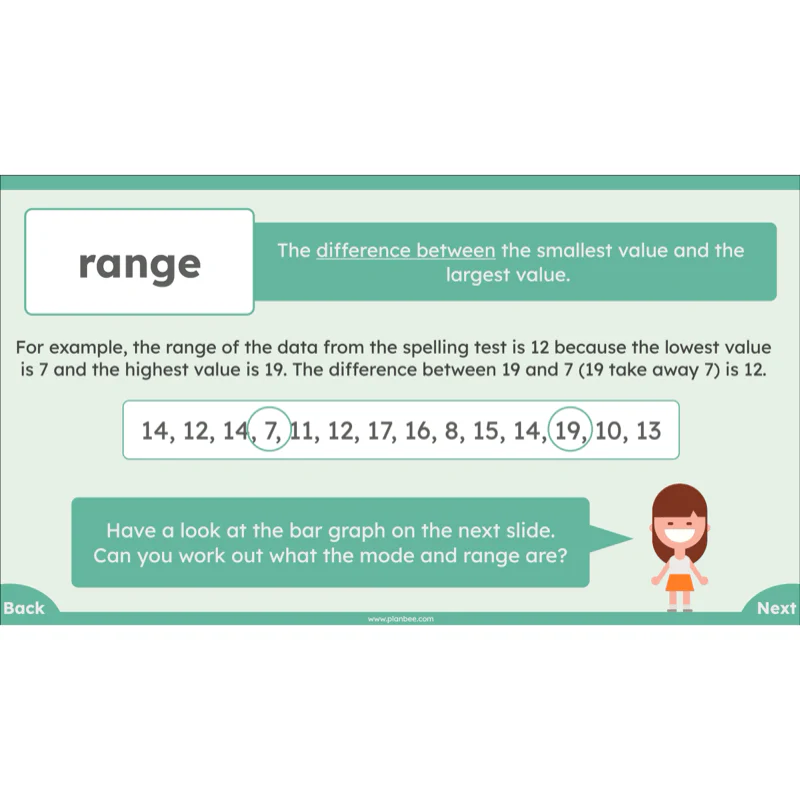
Interpreting Data
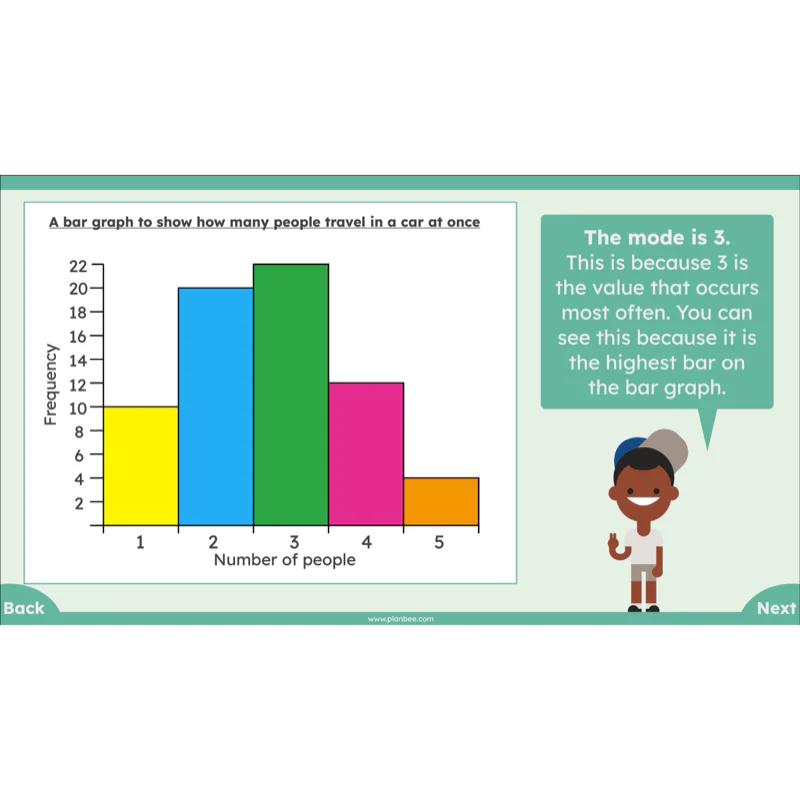
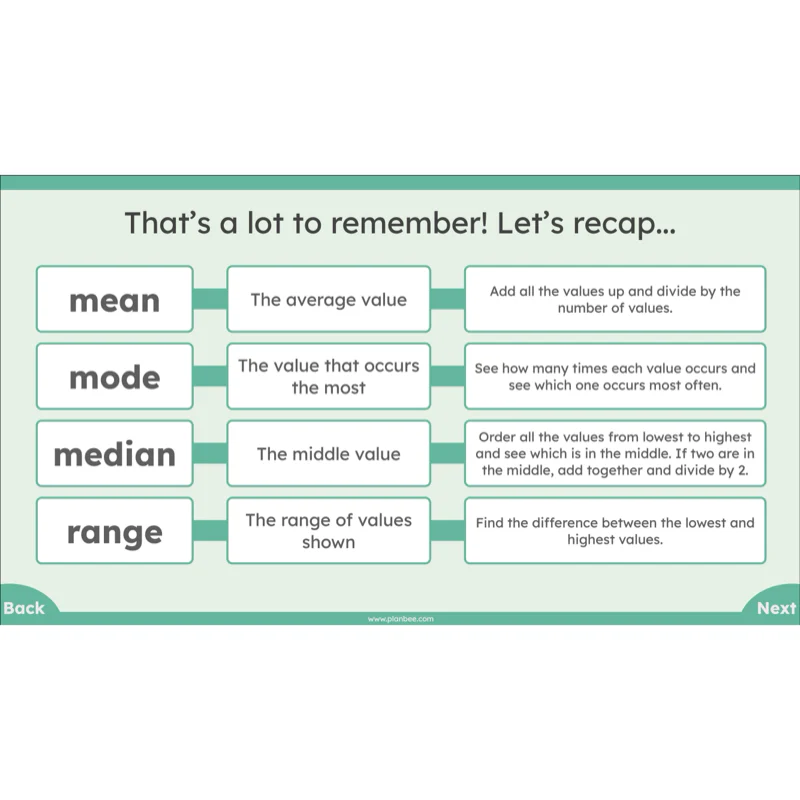
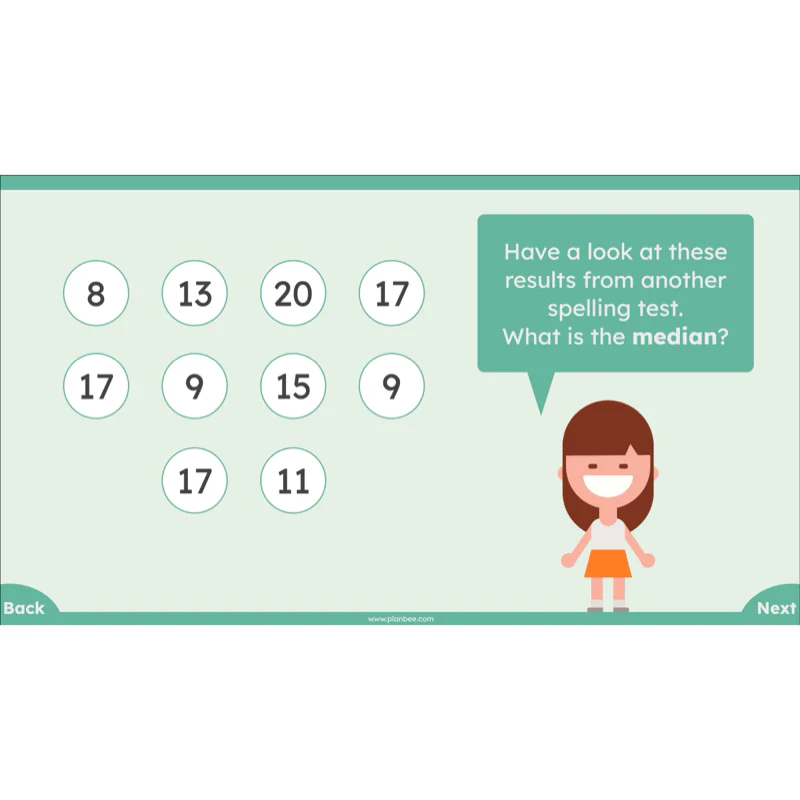
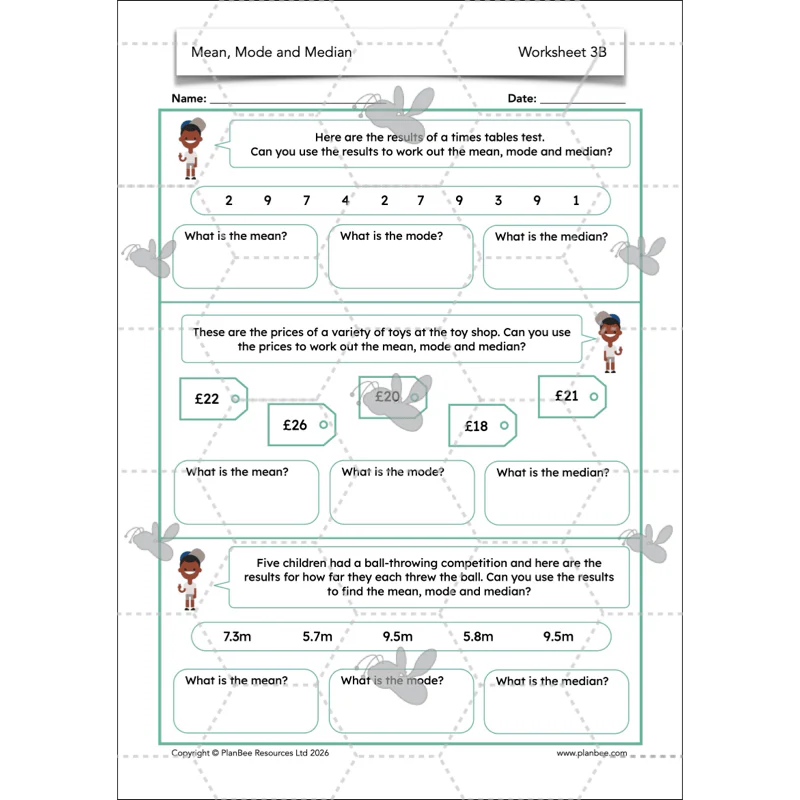
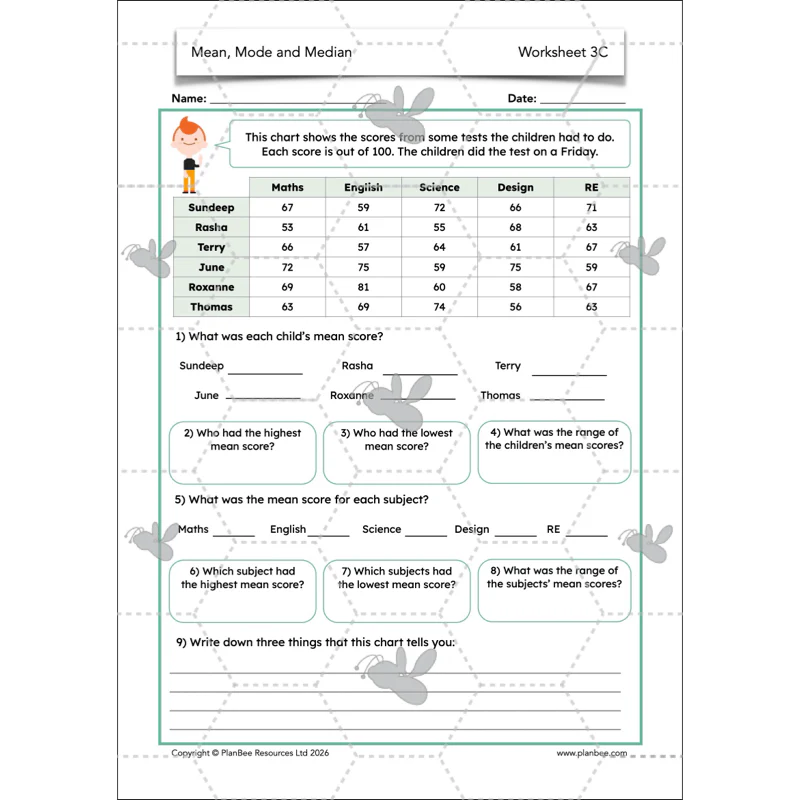
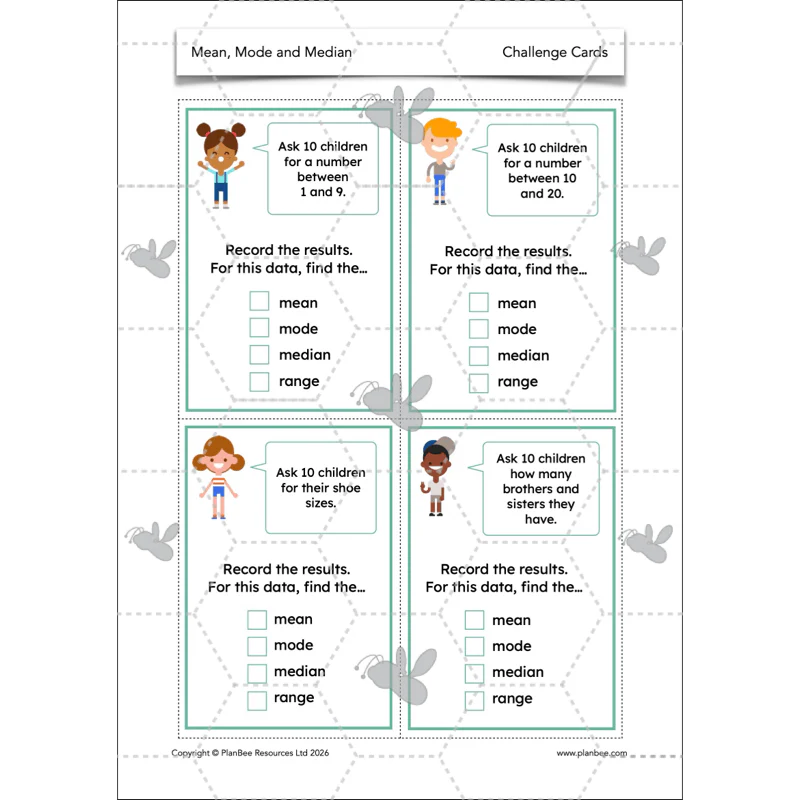
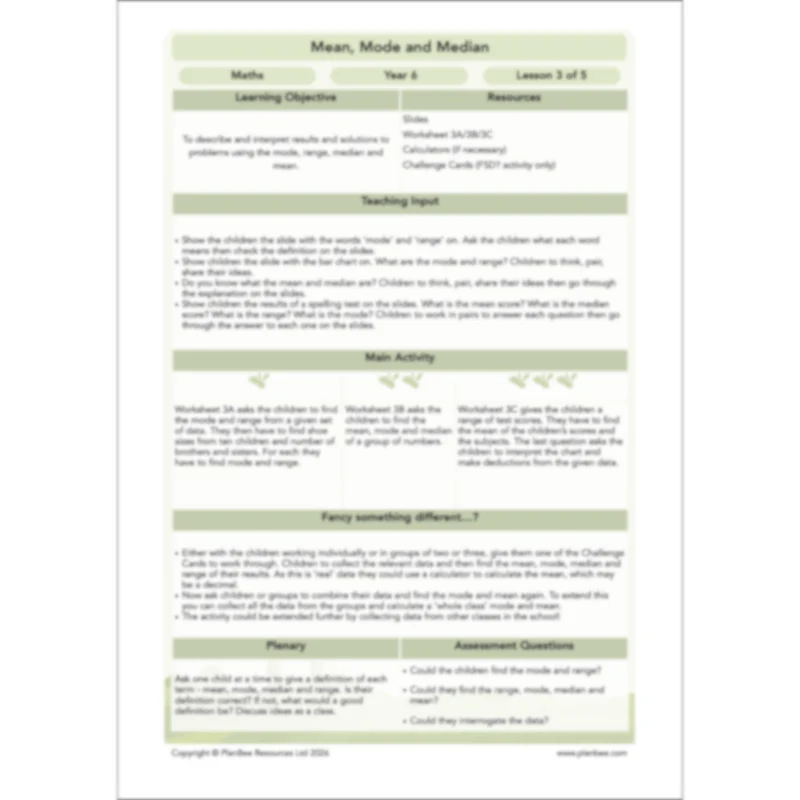
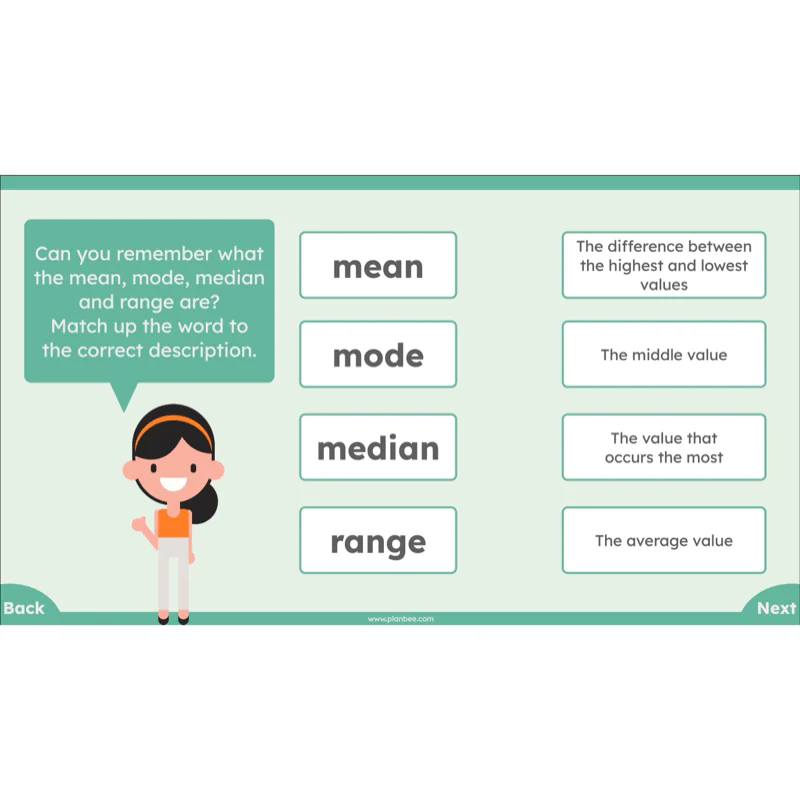
How does knowing the mean, mode and median of sets of data affect our understanding of it, or the way we interpret it? Children may consider these questions as they learn what these, and the term ‘range’ means as well as discovering how to find them in given sets of data. There’s plenty of opportunities during either of the included activities for children to practise these skills, too!
This downloadable lesson includes a lesson plan, slideshow presentation and printable teaching resources.
What's included:
- Lesson plan
- Slides
- Activity ideas
- Differentiated worksheets
- Challenge cards
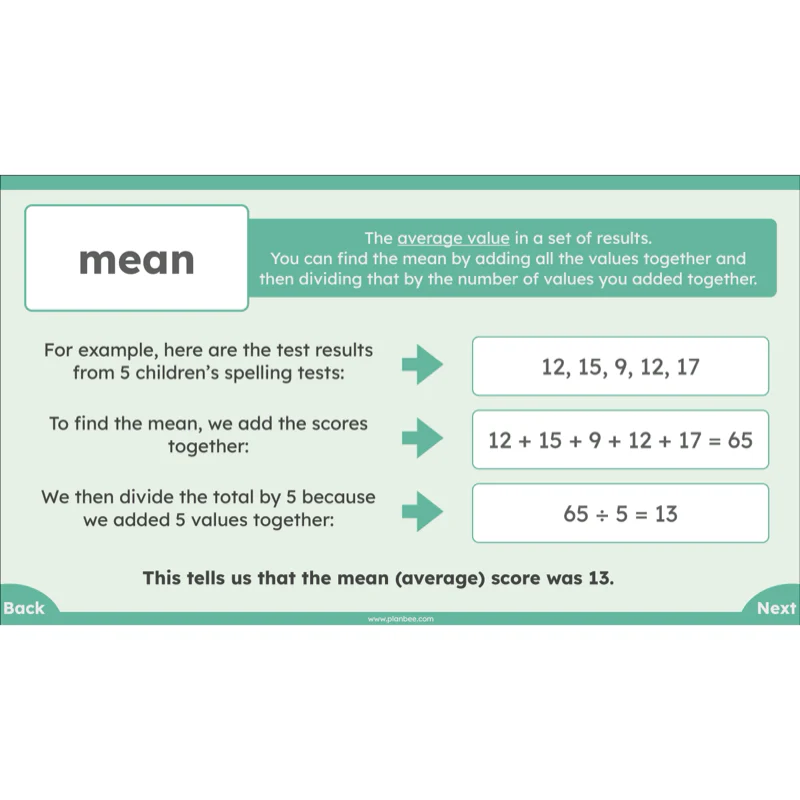
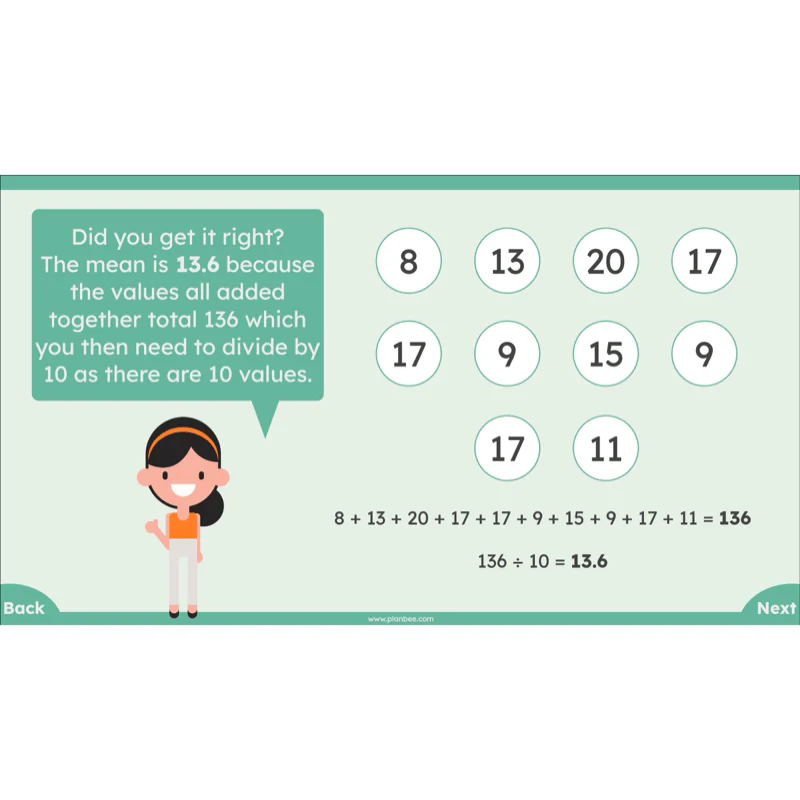
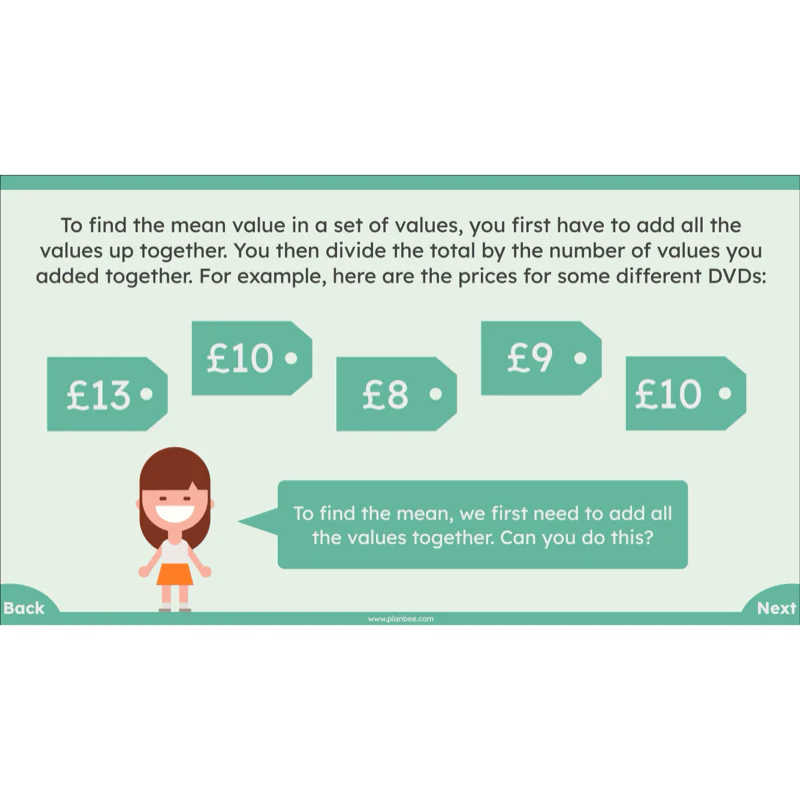
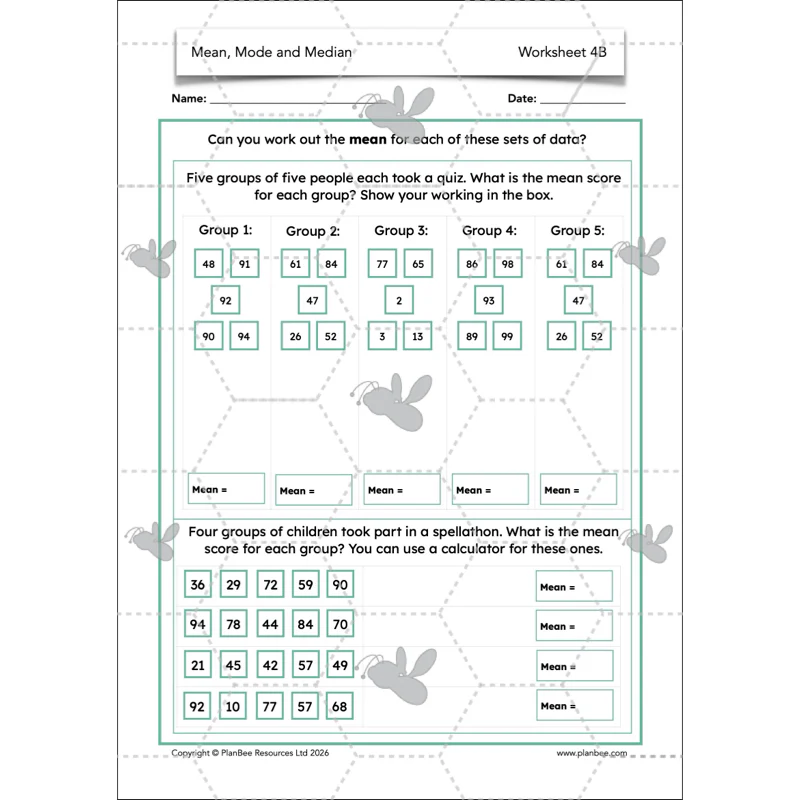
Mainly Mean
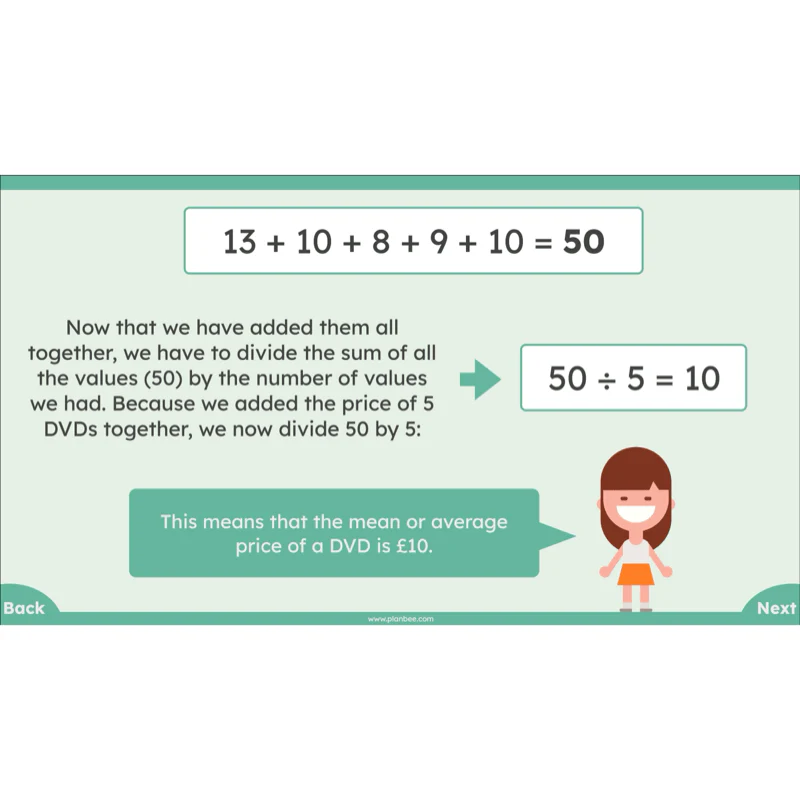
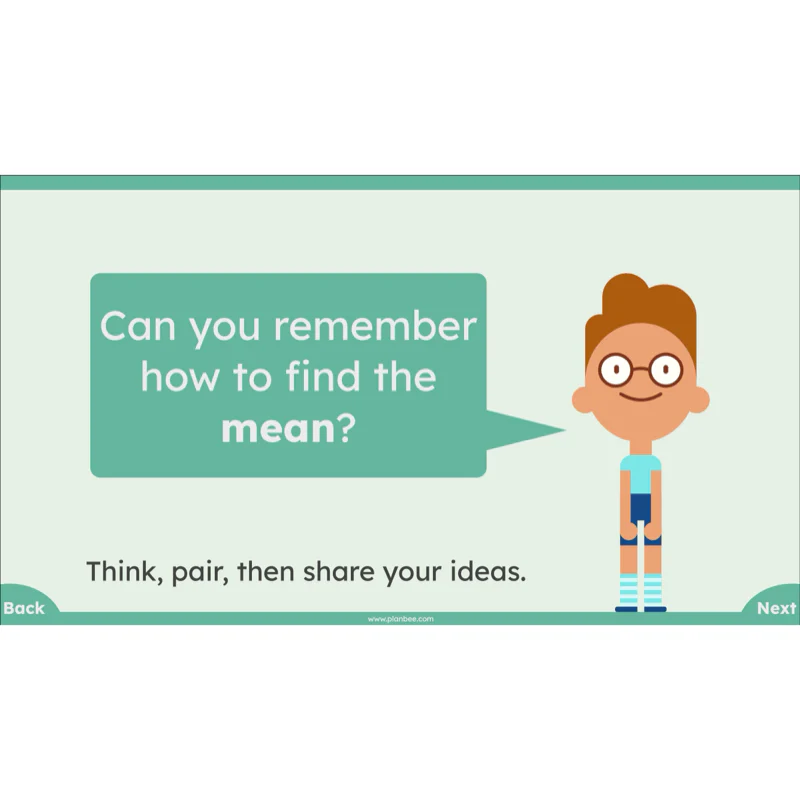
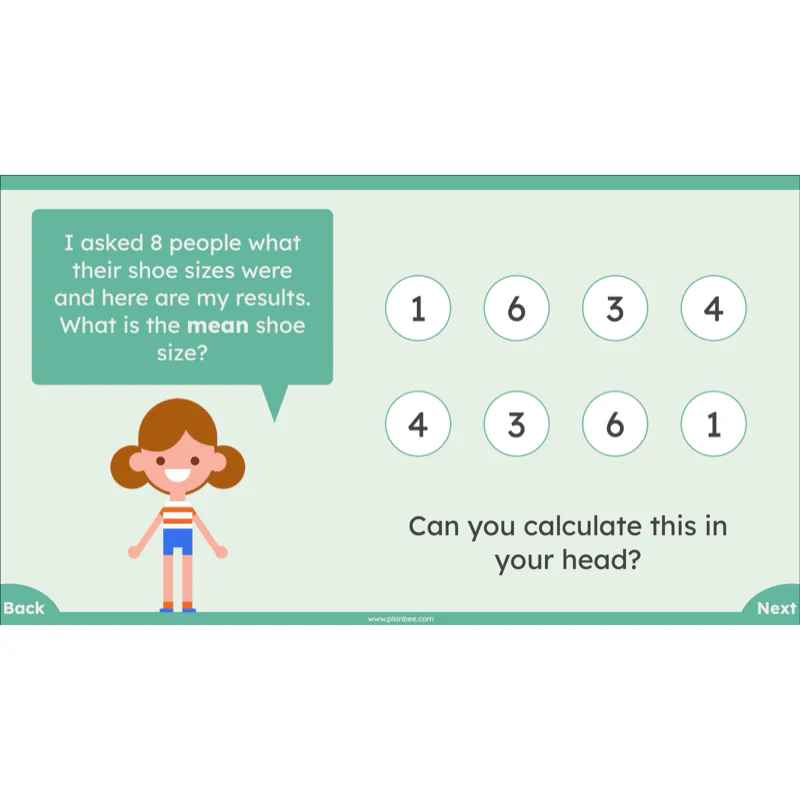
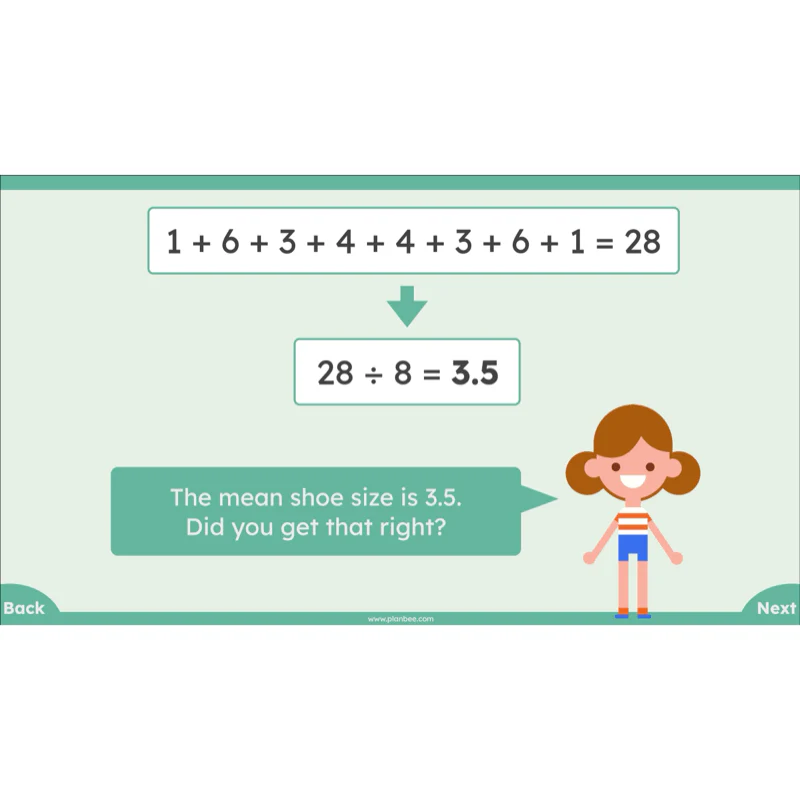
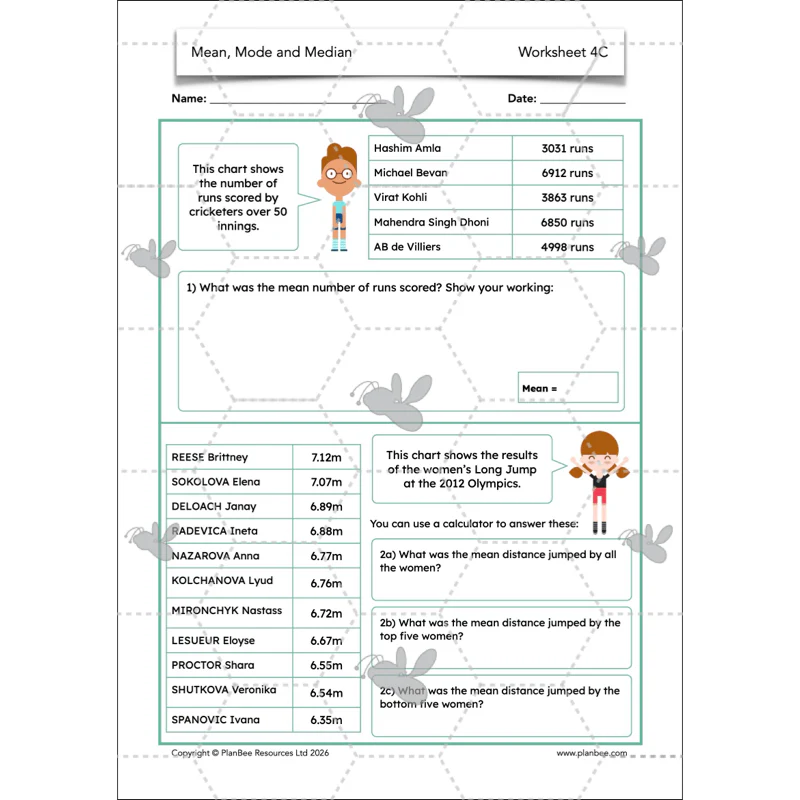
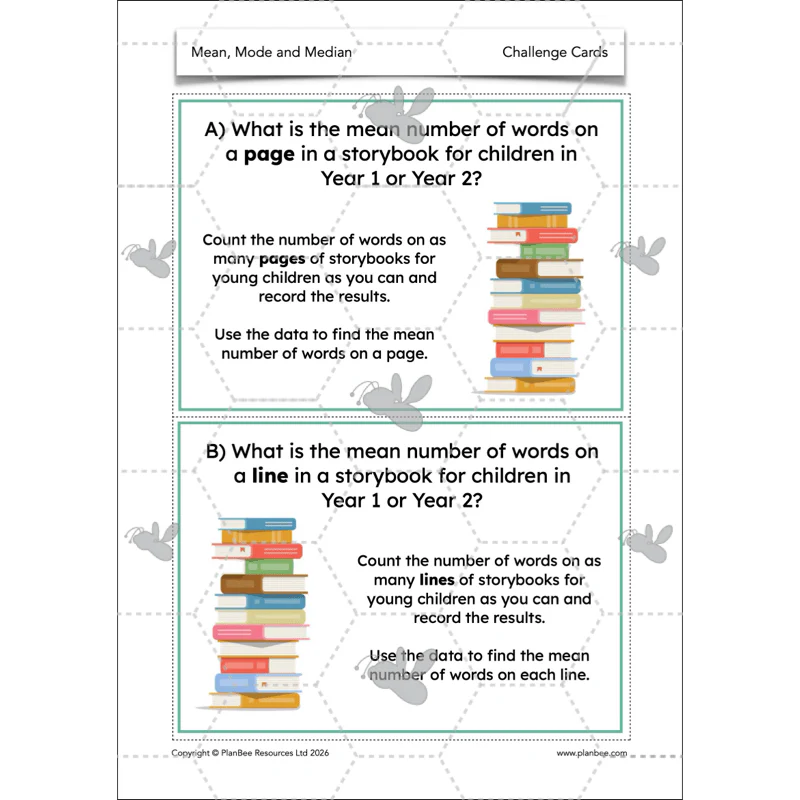
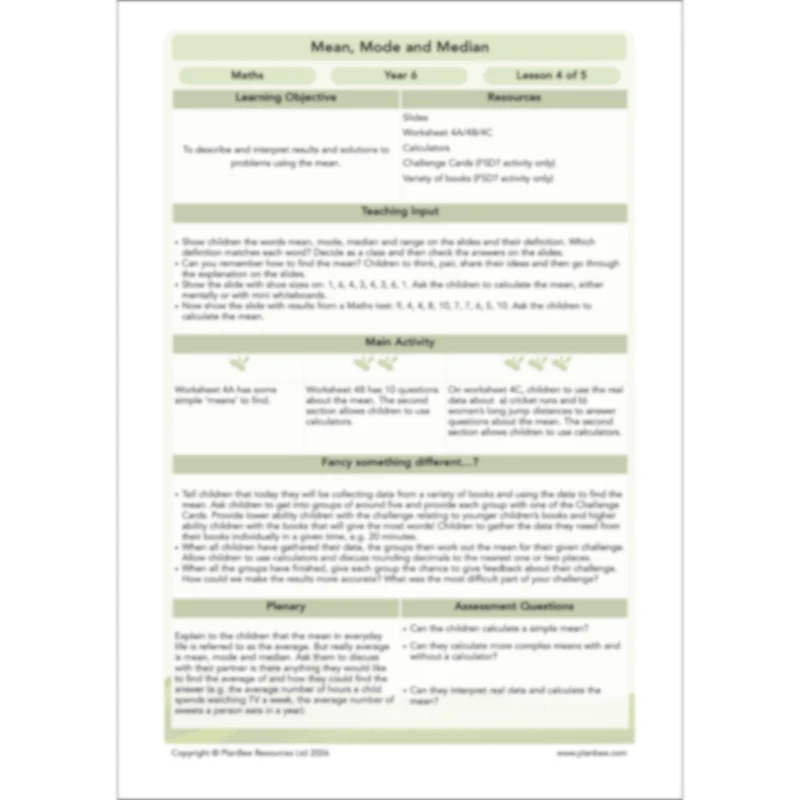
In this lesson, children will look more closely at finding the mean in given sets of data, then either practise finding the mean for given sets of data, or collect their own sets of data from which the mean averages can be found.
This downloadable lesson includes a lesson plan, slideshow presentation and printable teaching resources.
What's included:
- Lesson plan
- Slides
- Activity ideas
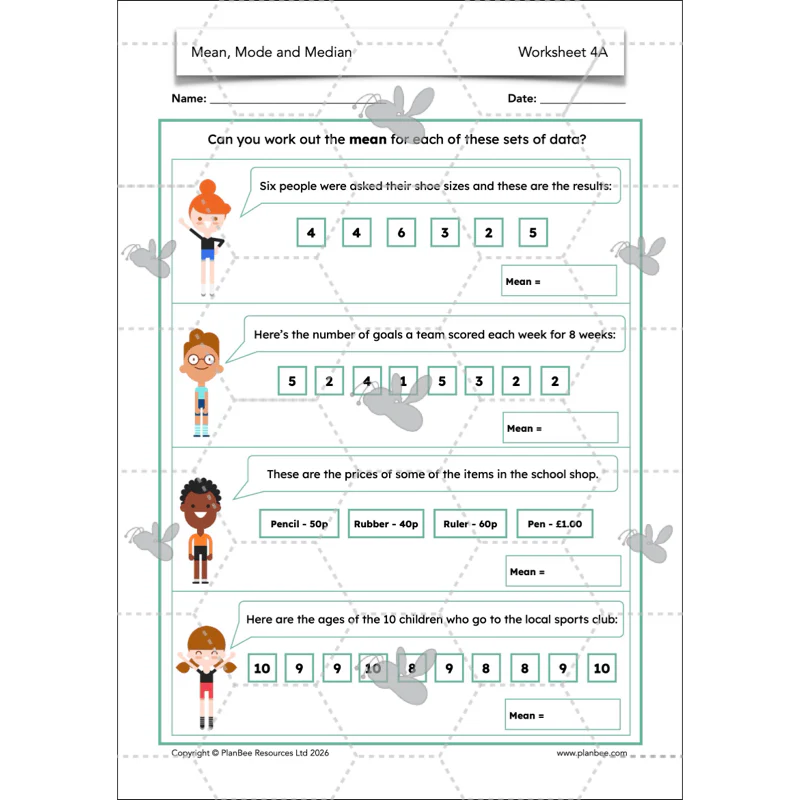
- Differentiated worksheets
- Challenge cards
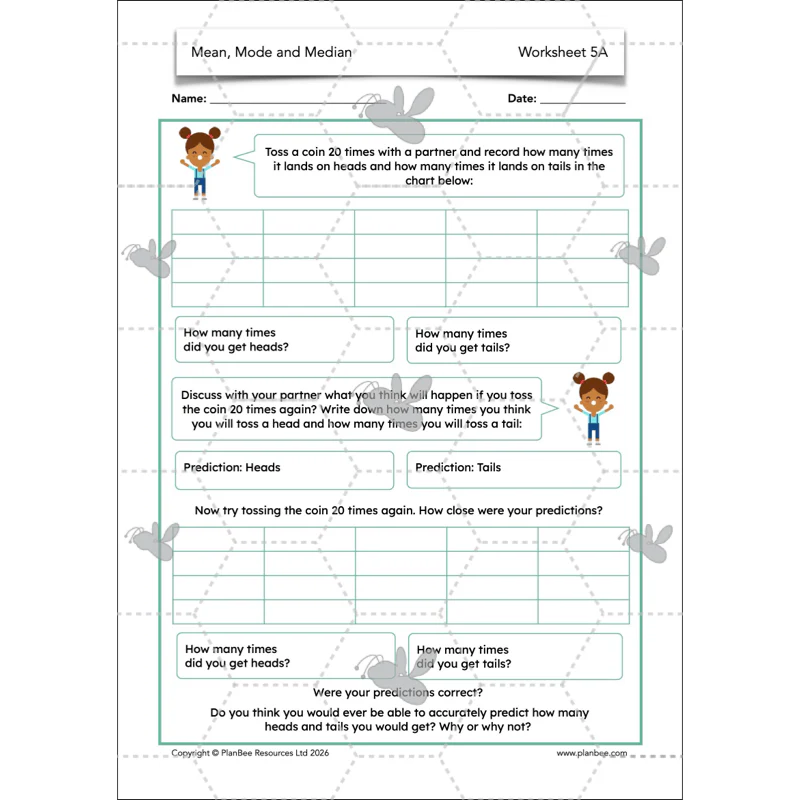
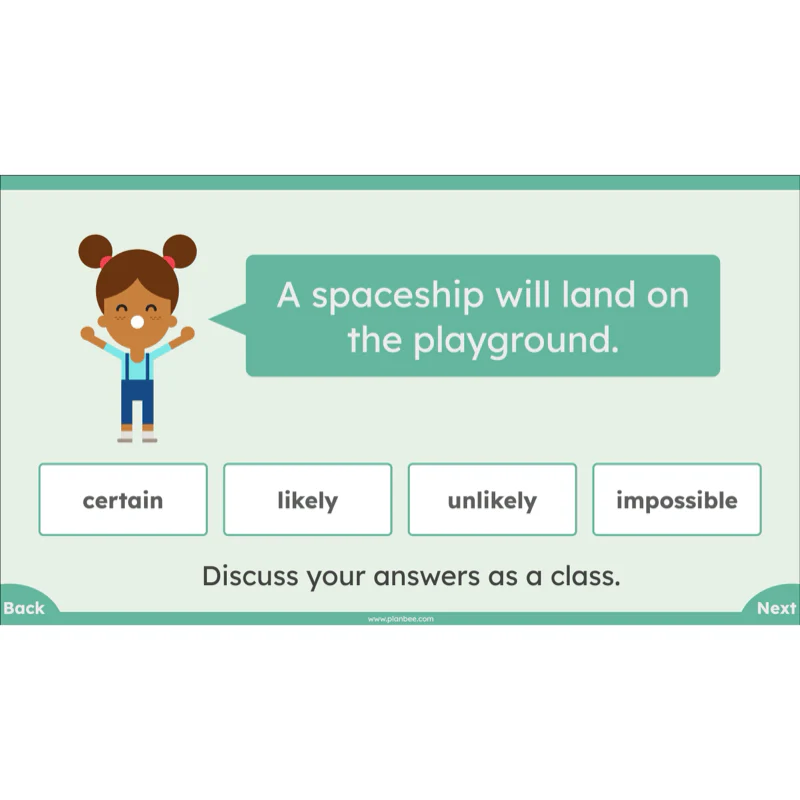
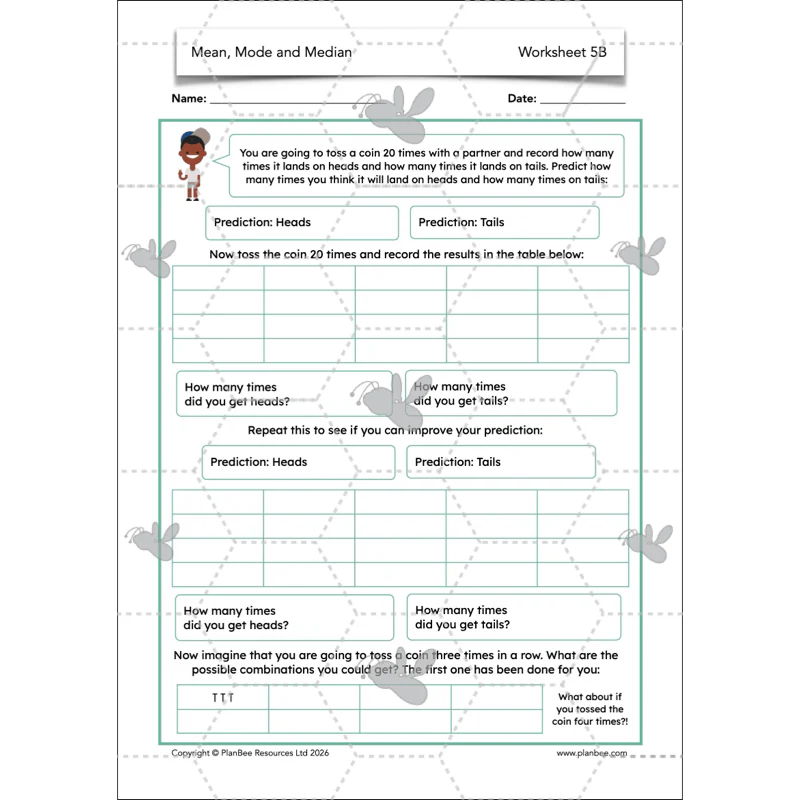
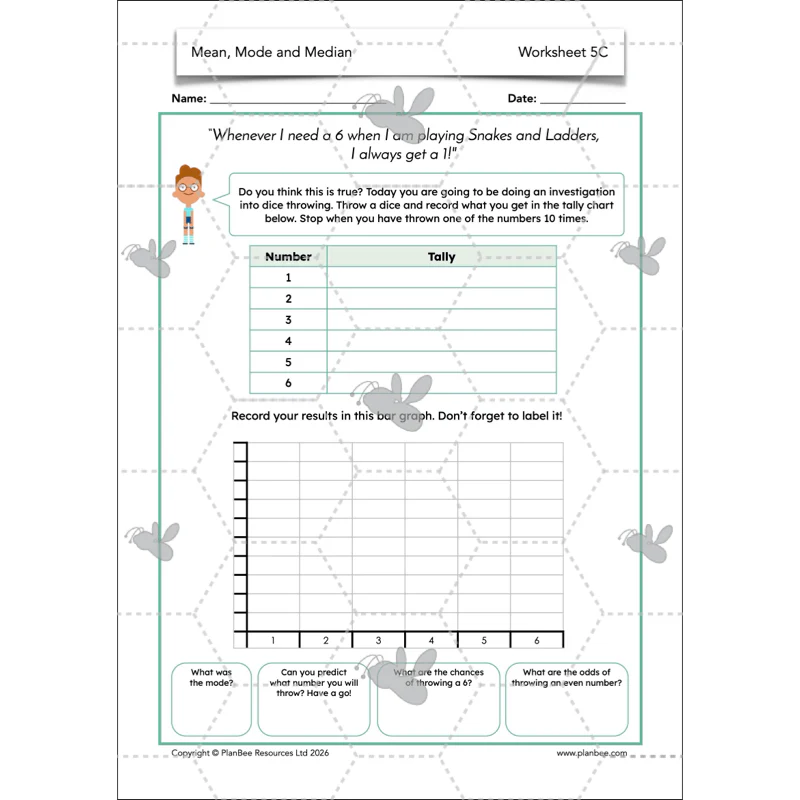
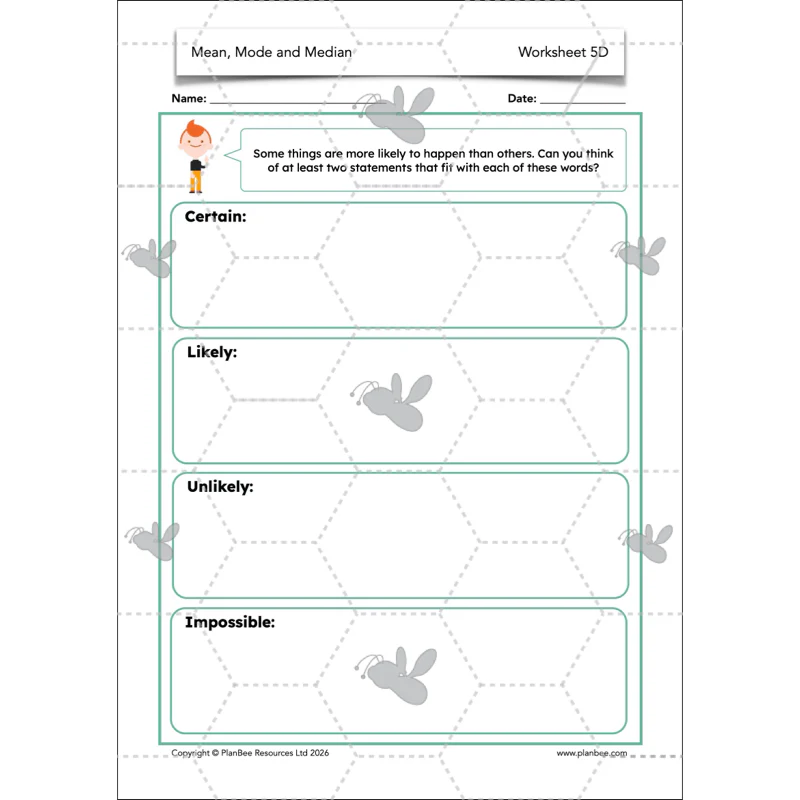
Chance and Likelihood
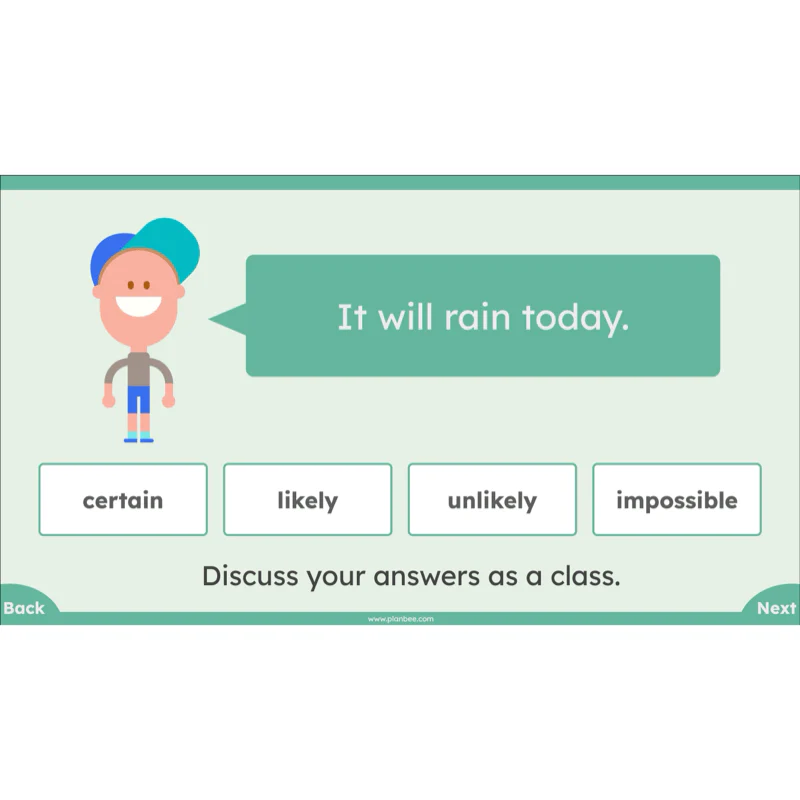
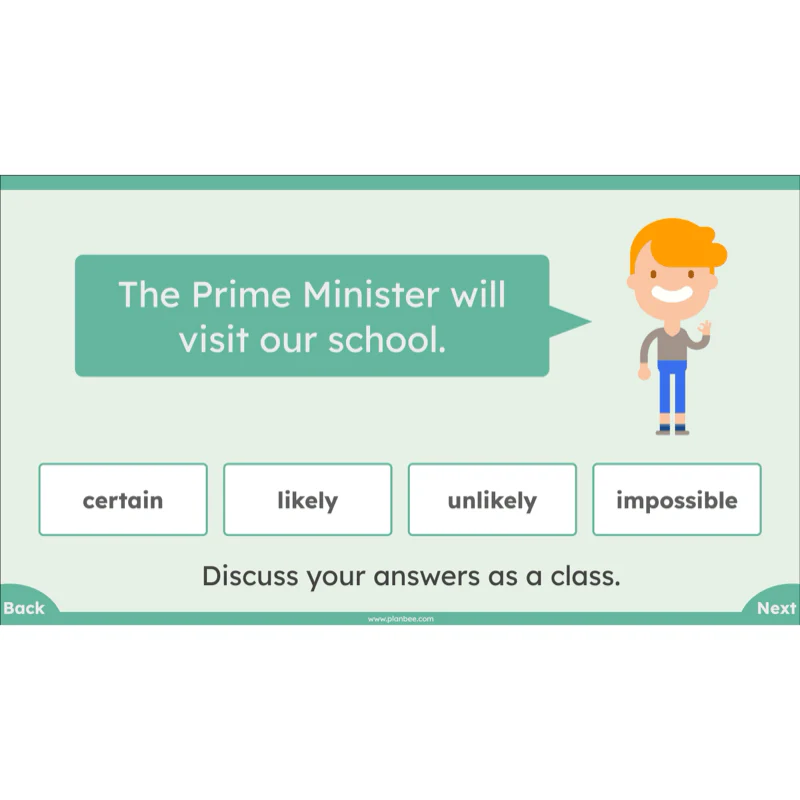
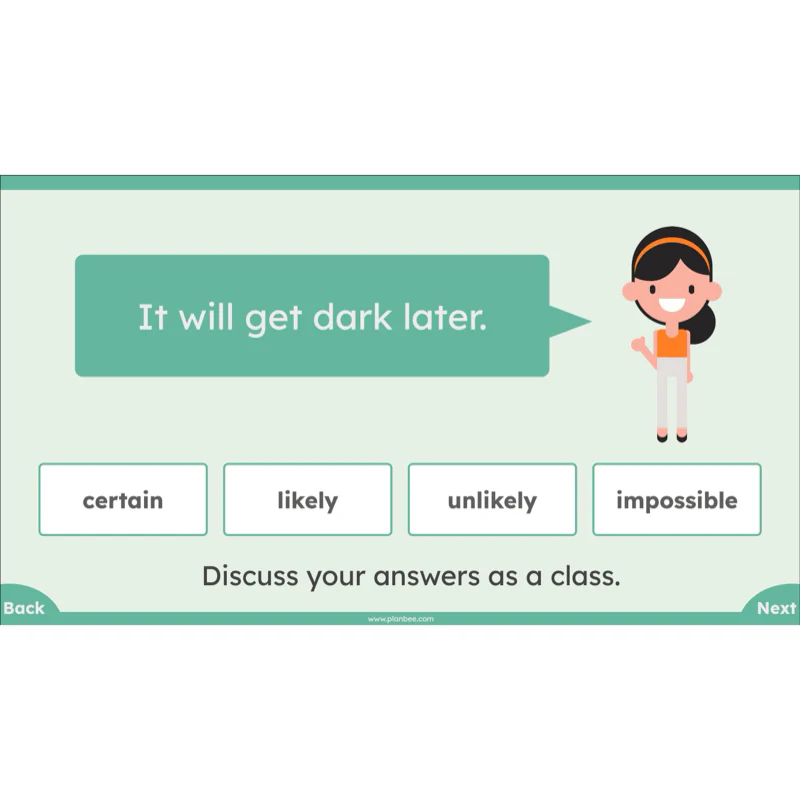
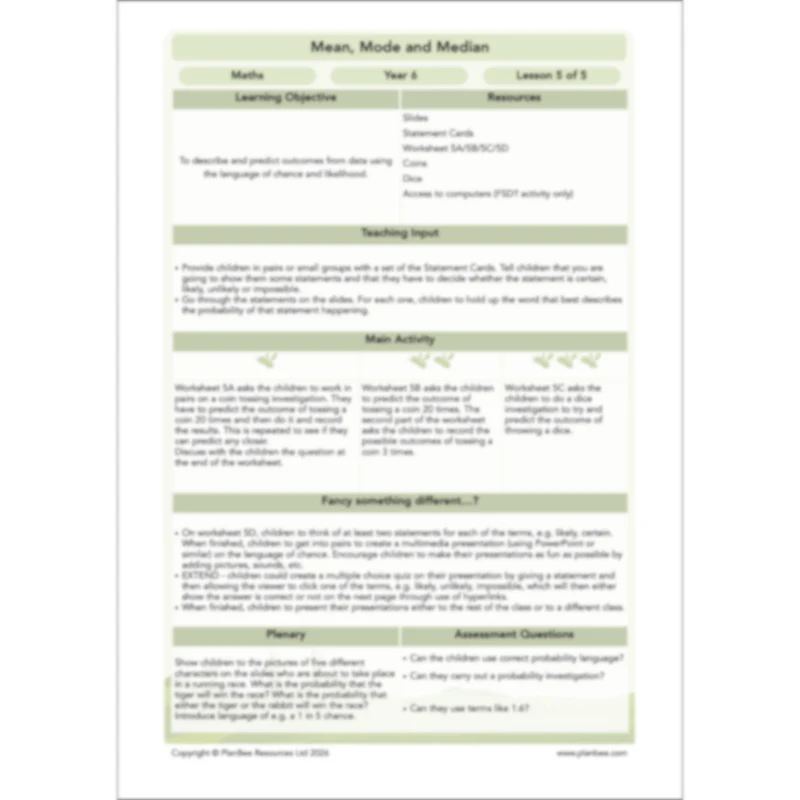
This lesson focuses on probability and — specifically — likelihood. Children will learn that sets of words can be used to describe and categorise degrees of likelihood, and that knowing the likelihood of outcomes allows us to predict events, such as the frequency with which a coin will land heads-up, or a rolled dice will land on a six! Following this, children may investigate the likelihood of events such as these for themselves during either of the two included activities.
This downloadable lesson includes a lesson plan, slideshow presentation and printable teaching resources.
What's included:
- Lesson plan
- Slides
- Activity ideas
- Differentiated worksheets
- Statement cards
Original: $3.49
-70%$3.49
$1.05More Images


Mean, Mode and Median
Teach your class to be dynamic data handlers! These lessons build on your children’s growing knowledge of charts, graphs and interpreting data by recapping the features of bar charts and line graphs, then challenging them to plot multiple sets of data as well as write and answer questions. Following on from this, children can tuck into some pie charts, learning how to read and interpret them as well as beginning to learn how to make them. As if that wasn’t enough, they’ll also consider different ways in which data can be gathered, sorted and interpreted by finding the mean, mode or median in given sets of data, and looking at how we can predict outcomes of events by considering their likelihood.
This downloadable series of lessons comes with detailed lesson plans, engaging slideshow presentations and printable teaching resources.
Graphs and Charts
Recap the features of bar charts and line graphs, then challenge children to read and interpret information shown using them. Following this, children may practise drawing line graphs showing two or more sets of data, then ask and answer questions about the data shown.
This downloadable lesson includes a lesson plan, slideshow presentation and printable teaching resources.
What's included:
- Lesson plan
- Slides
- Activity ideas
- Differentiated worksheets
- Squared paper
Pie Charts
The included slides with this lesson describe the features of pie charts, then ask children to read and interpret data presented in them. Following this, either challenge children to ask and answer their own questions about data in pie charts, or undertake group activities where children will draw their own simple pie charts.
This downloadable lesson includes a lesson plan, slideshow presentation and printable teaching resources.
What's included:
- Lesson plan
- Slides
- Activity ideas
- Differentiated worksheets
Interpreting Data
How does knowing the mean, mode and median of sets of data affect our understanding of it, or the way we interpret it? Children may consider these questions as they learn what these, and the term ‘range’ means as well as discovering how to find them in given sets of data. There’s plenty of opportunities during either of the included activities for children to practise these skills, too!
This downloadable lesson includes a lesson plan, slideshow presentation and printable teaching resources.
What's included:
- Lesson plan
- Slides
- Activity ideas
- Differentiated worksheets
- Challenge cards
Mainly Mean
In this lesson, children will look more closely at finding the mean in given sets of data, then either practise finding the mean for given sets of data, or collect their own sets of data from which the mean averages can be found.
This downloadable lesson includes a lesson plan, slideshow presentation and printable teaching resources.
What's included:
- Lesson plan
- Slides
- Activity ideas
- Differentiated worksheets
- Challenge cards
Chance and Likelihood
This lesson focuses on probability and — specifically — likelihood. Children will learn that sets of words can be used to describe and categorise degrees of likelihood, and that knowing the likelihood of outcomes allows us to predict events, such as the frequency with which a coin will land heads-up, or a rolled dice will land on a six! Following this, children may investigate the likelihood of events such as these for themselves during either of the two included activities.
This downloadable lesson includes a lesson plan, slideshow presentation and printable teaching resources.
What's included:
- Lesson plan
- Slides
- Activity ideas
- Differentiated worksheets
- Statement cards
Product Information
Product Information
Shipping & Returns
Shipping & Returns
Description
Teach your class to be dynamic data handlers! These lessons build on your children’s growing knowledge of charts, graphs and interpreting data by recapping the features of bar charts and line graphs, then challenging them to plot multiple sets of data as well as write and answer questions. Following on from this, children can tuck into some pie charts, learning how to read and interpret them as well as beginning to learn how to make them. As if that wasn’t enough, they’ll also consider different ways in which data can be gathered, sorted and interpreted by finding the mean, mode or median in given sets of data, and looking at how we can predict outcomes of events by considering their likelihood.
This downloadable series of lessons comes with detailed lesson plans, engaging slideshow presentations and printable teaching resources.
Graphs and Charts
Recap the features of bar charts and line graphs, then challenge children to read and interpret information shown using them. Following this, children may practise drawing line graphs showing two or more sets of data, then ask and answer questions about the data shown.
This downloadable lesson includes a lesson plan, slideshow presentation and printable teaching resources.
What's included:
- Lesson plan
- Slides
- Activity ideas
- Differentiated worksheets
- Squared paper
Pie Charts
The included slides with this lesson describe the features of pie charts, then ask children to read and interpret data presented in them. Following this, either challenge children to ask and answer their own questions about data in pie charts, or undertake group activities where children will draw their own simple pie charts.
This downloadable lesson includes a lesson plan, slideshow presentation and printable teaching resources.
What's included:
- Lesson plan
- Slides
- Activity ideas
- Differentiated worksheets
Interpreting Data
How does knowing the mean, mode and median of sets of data affect our understanding of it, or the way we interpret it? Children may consider these questions as they learn what these, and the term ‘range’ means as well as discovering how to find them in given sets of data. There’s plenty of opportunities during either of the included activities for children to practise these skills, too!
This downloadable lesson includes a lesson plan, slideshow presentation and printable teaching resources.
What's included:
- Lesson plan
- Slides
- Activity ideas
- Differentiated worksheets
- Challenge cards
Mainly Mean
In this lesson, children will look more closely at finding the mean in given sets of data, then either practise finding the mean for given sets of data, or collect their own sets of data from which the mean averages can be found.
This downloadable lesson includes a lesson plan, slideshow presentation and printable teaching resources.
What's included:
- Lesson plan
- Slides
- Activity ideas
- Differentiated worksheets
- Challenge cards
Chance and Likelihood
This lesson focuses on probability and — specifically — likelihood. Children will learn that sets of words can be used to describe and categorise degrees of likelihood, and that knowing the likelihood of outcomes allows us to predict events, such as the frequency with which a coin will land heads-up, or a rolled dice will land on a six! Following this, children may investigate the likelihood of events such as these for themselves during either of the two included activities.
This downloadable lesson includes a lesson plan, slideshow presentation and printable teaching resources.
What's included:
- Lesson plan
- Slides
- Activity ideas
- Differentiated worksheets
- Statement cards