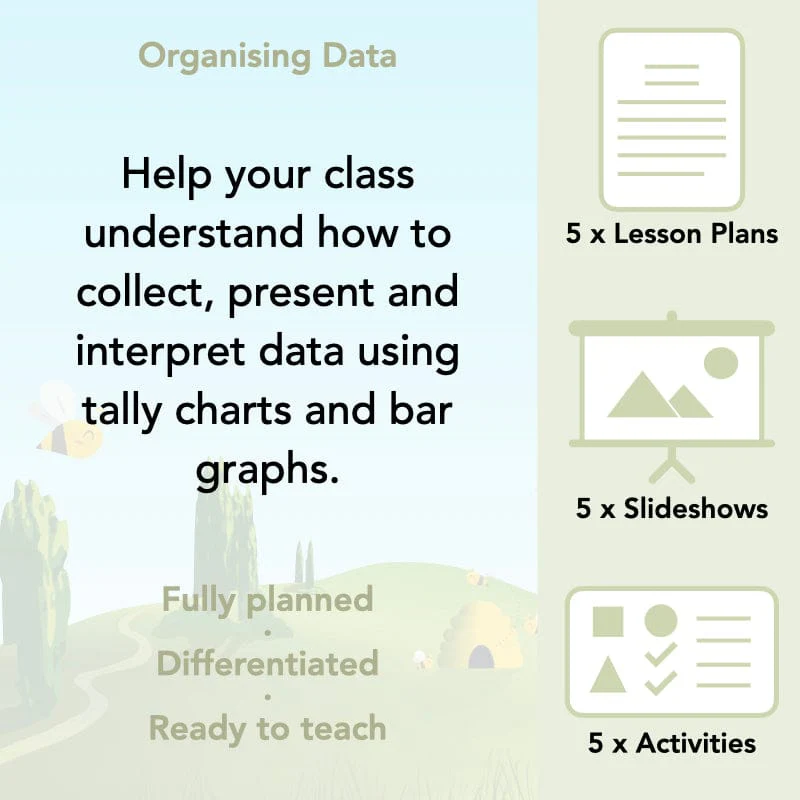
Organising Data
Explore how to capture, present and interpret data using tally charts and bar charts in this series of five lessons for Year 3 children. Teaching 7-8 year-olds how to read and draw bar charts accurately can be tricky! We've put these plans, slides, worksheets and other printable resources together to help make teaching these tricky maths skills a little bit easier. The resources will help children progress from using simple tables and pictograms to using increasingly complex bar charts with groups/ranges of data at different scales. Each lesson comes with a choice of activities so you can choose the ideal learning journey for your children.
Each lesson includes a detailed plan, an informative set of slides for the teaching input, and differentiated worksheets.
Start using bar charts
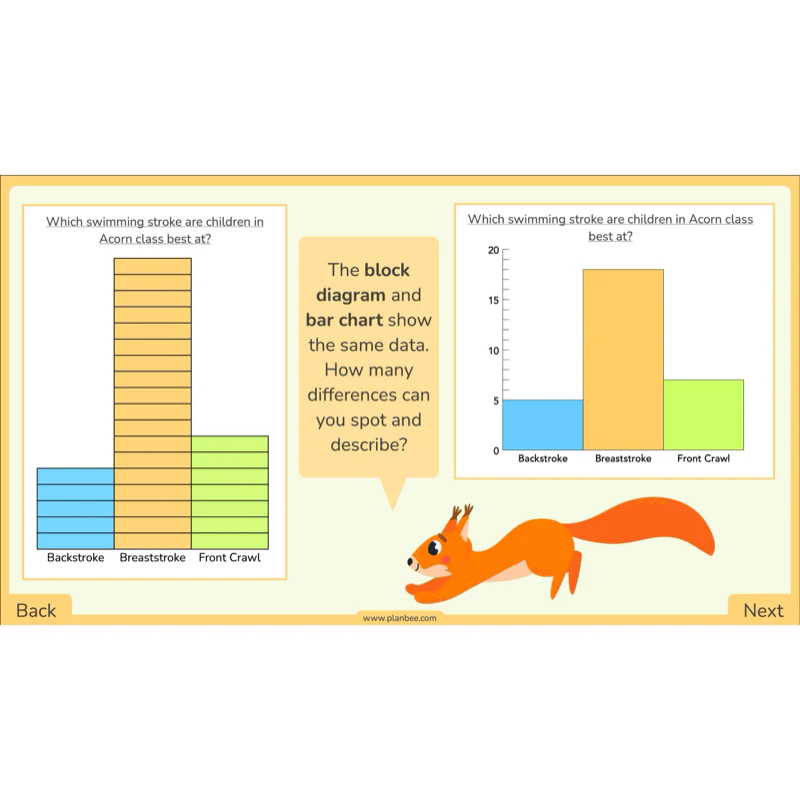
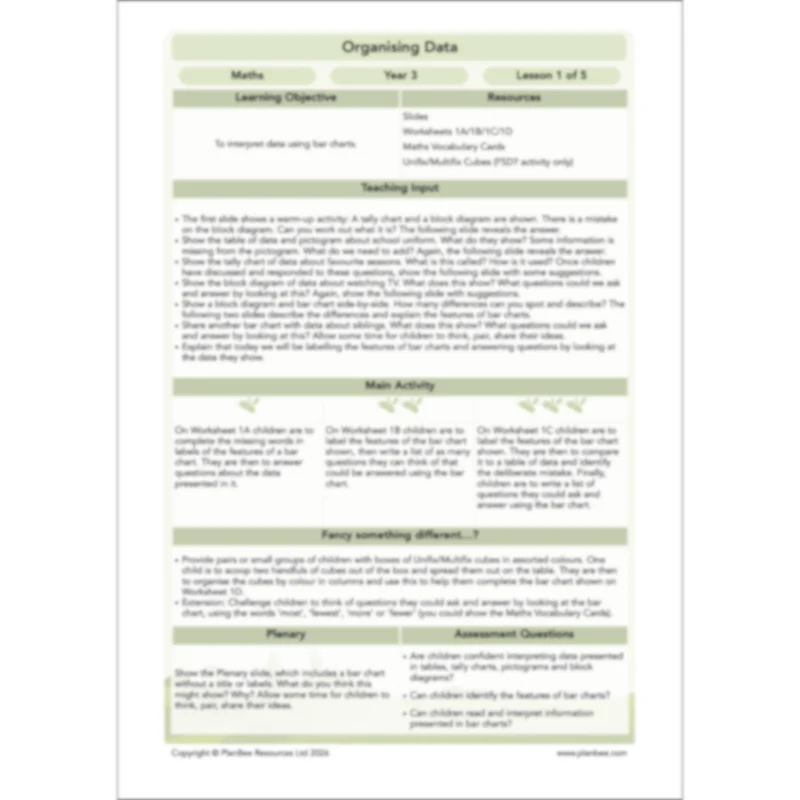
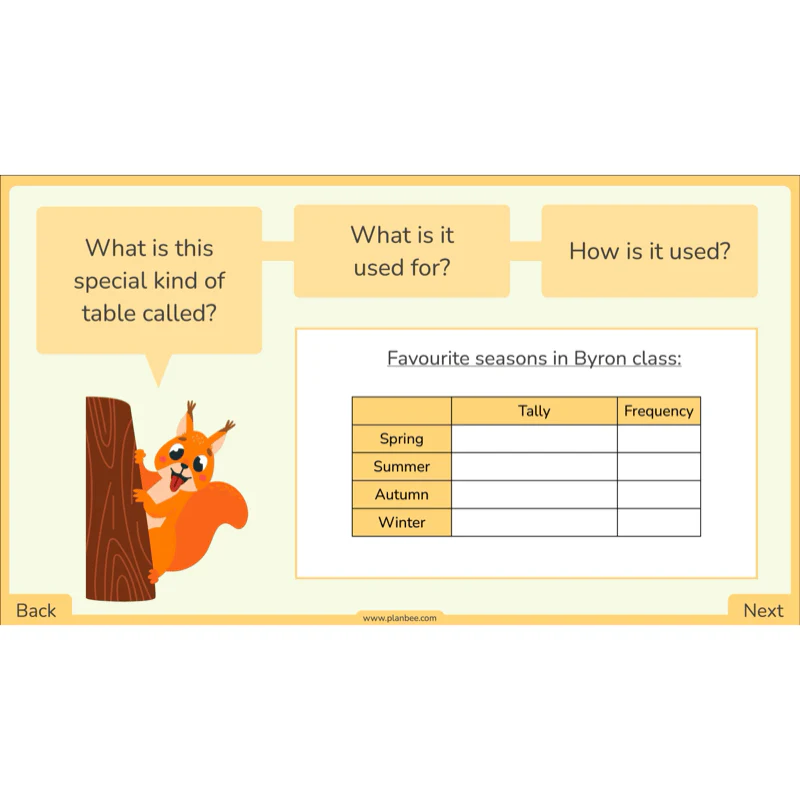
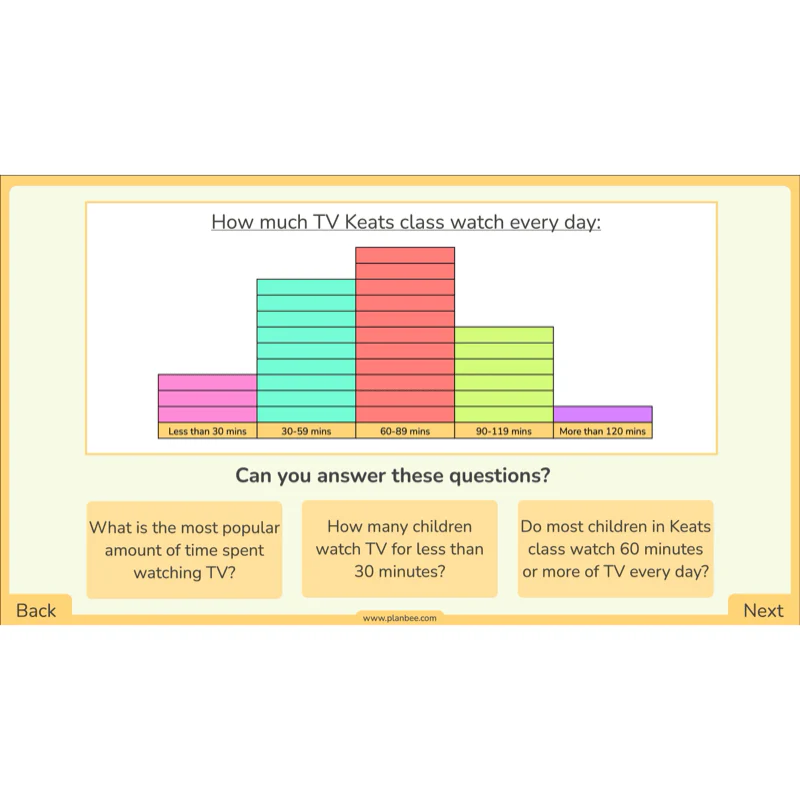
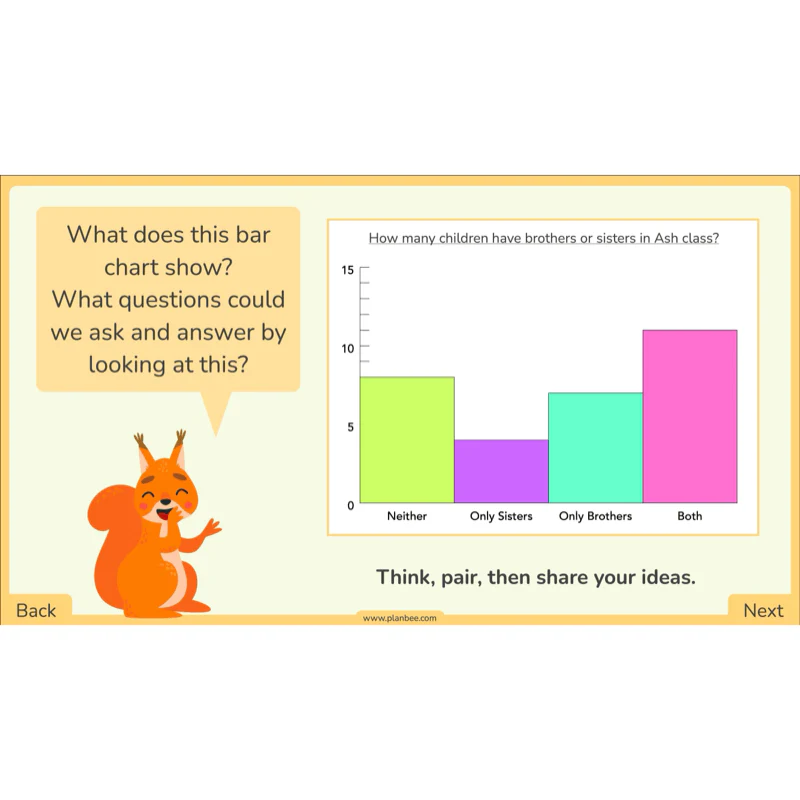
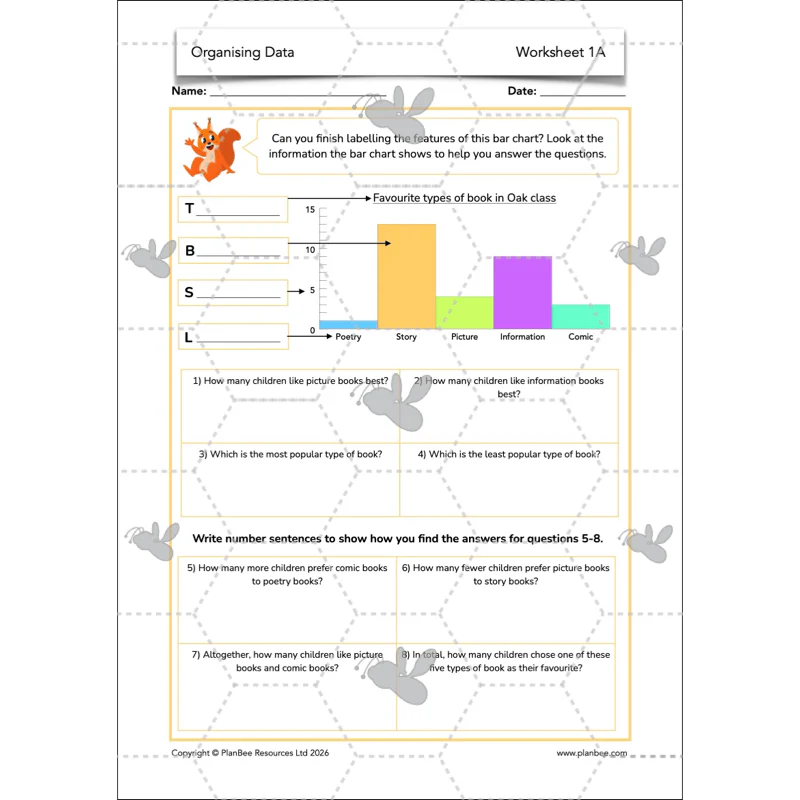
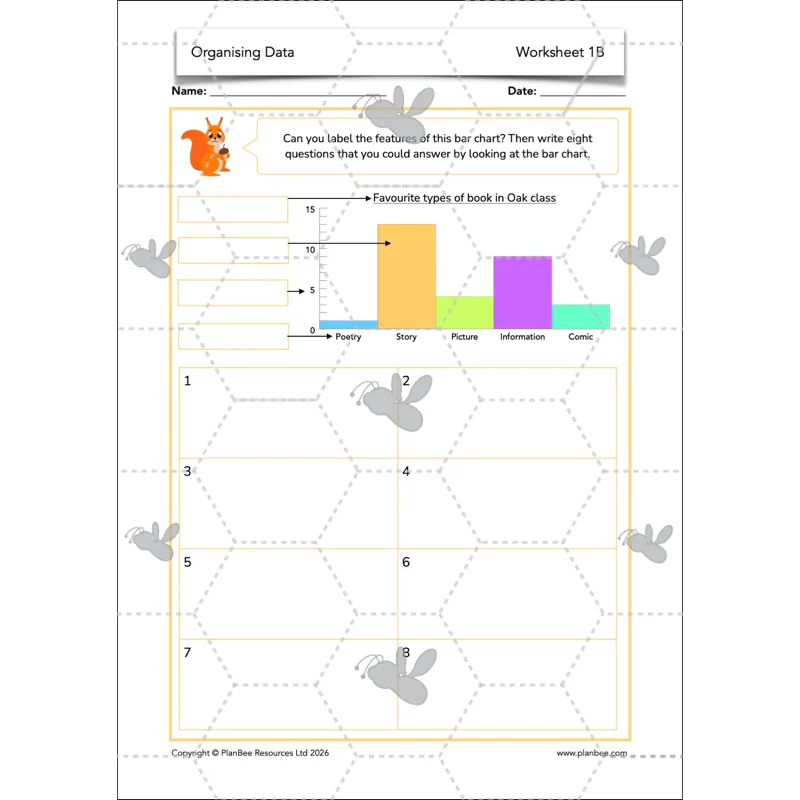
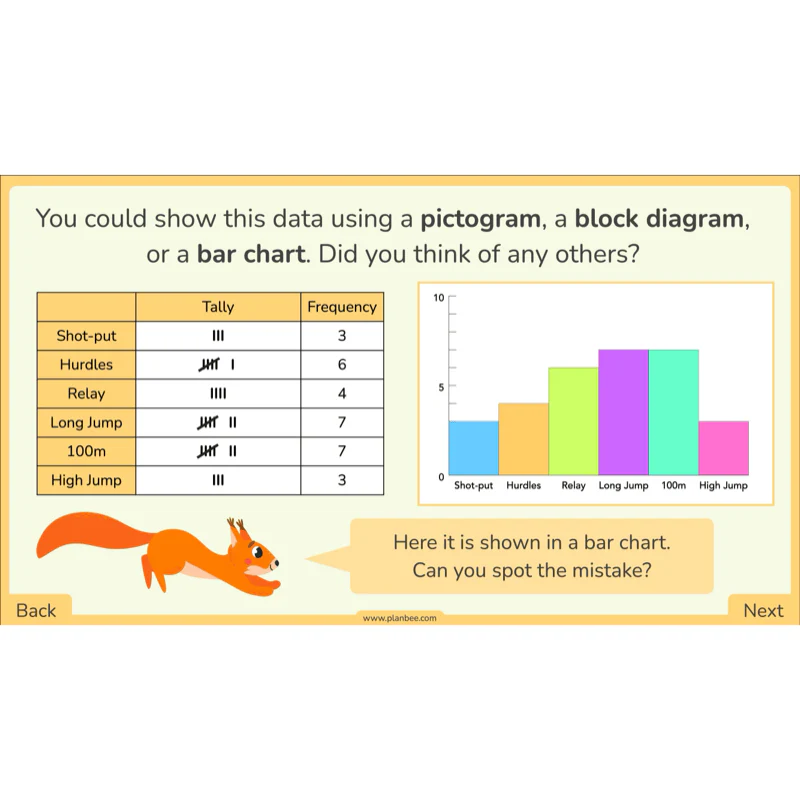
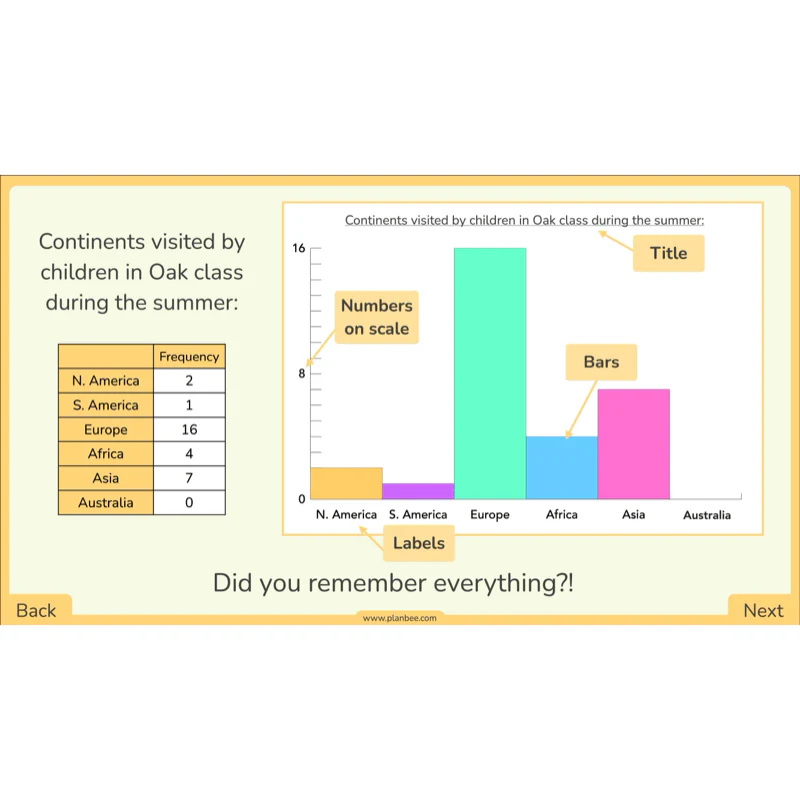
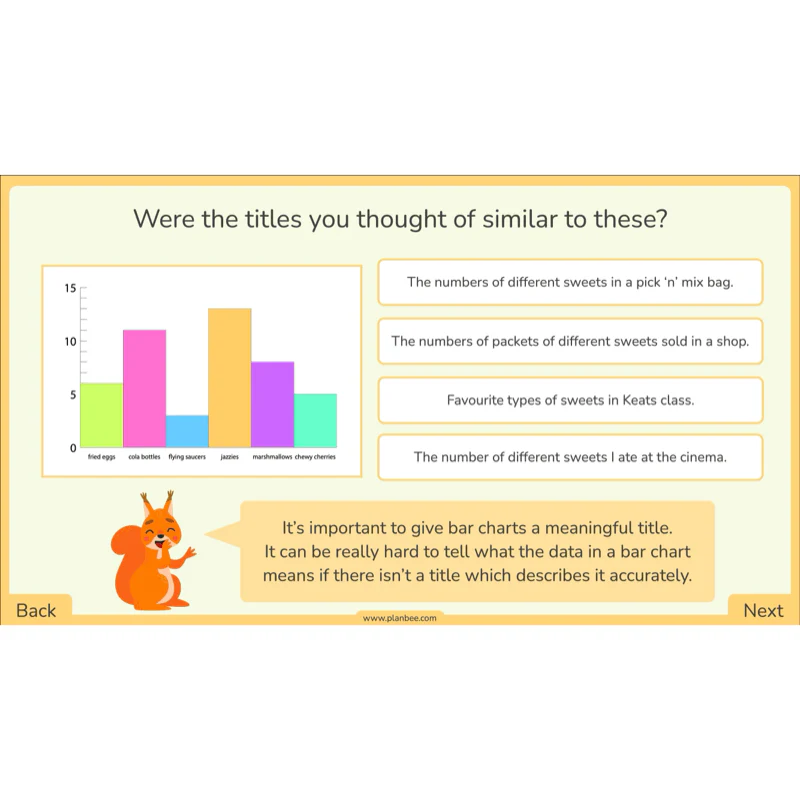
Kick-start the week's maths learning by recapping ways of presenting data which children may already be familiar with, such as straightforward tables, pictograms and block diagrams. Moving on, the slides show the features of bar charts and how data can be presented in them. Following this there's a choice of activities, either of which will encourage children to start using bar charts as well as using mathematical vocabulary to describe them.
This downloadable lesson includes a lesson plan, slideshow presentation and printable teaching resources.
What's included:
- Lesson plan
- Slides
- Activity ideas
- Differentiated worksheets
- Maths vocabulary cards
Presenting data
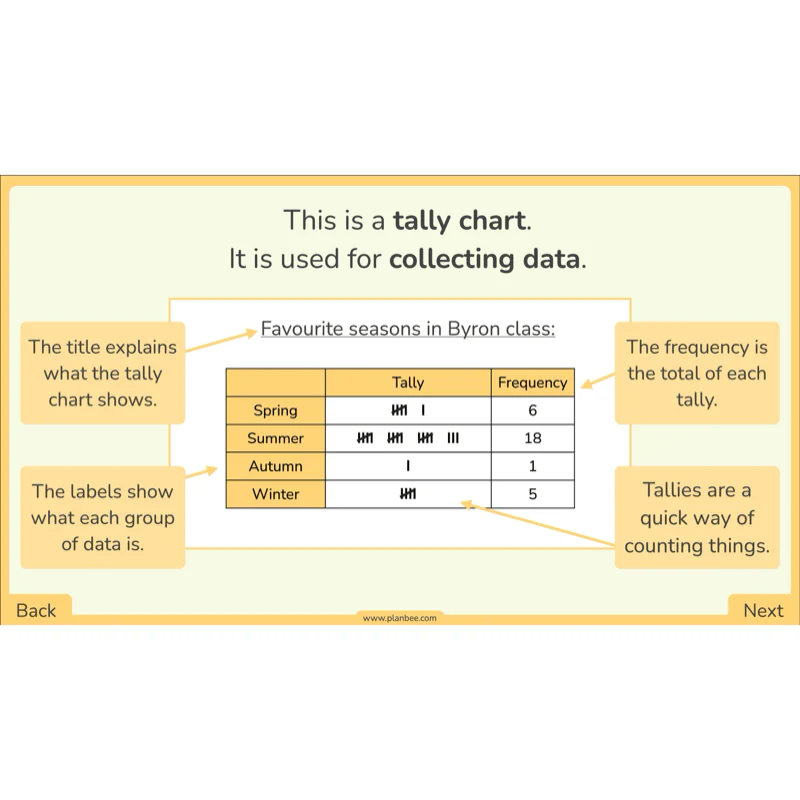
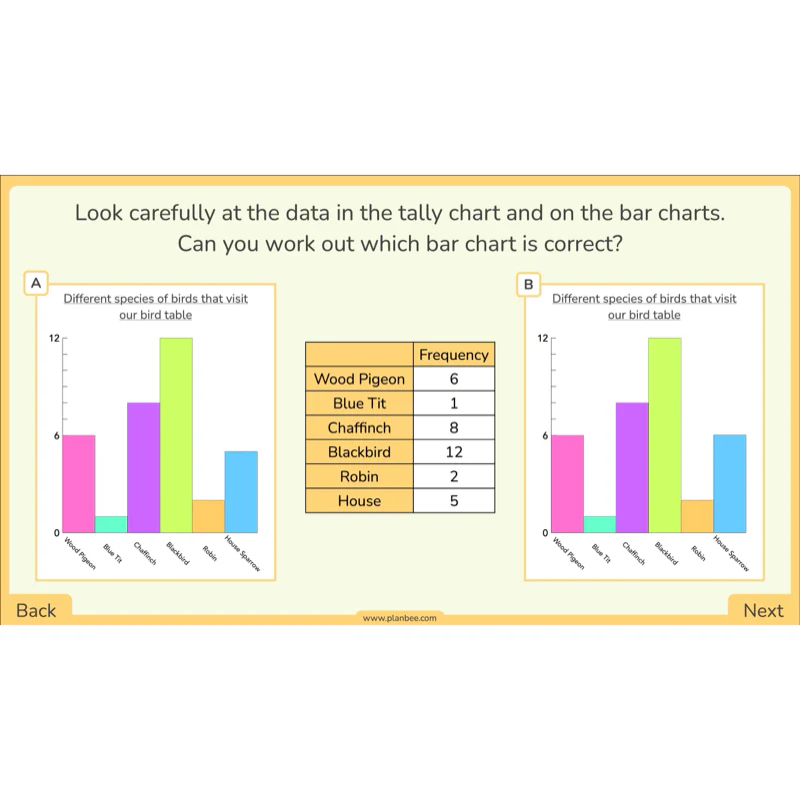
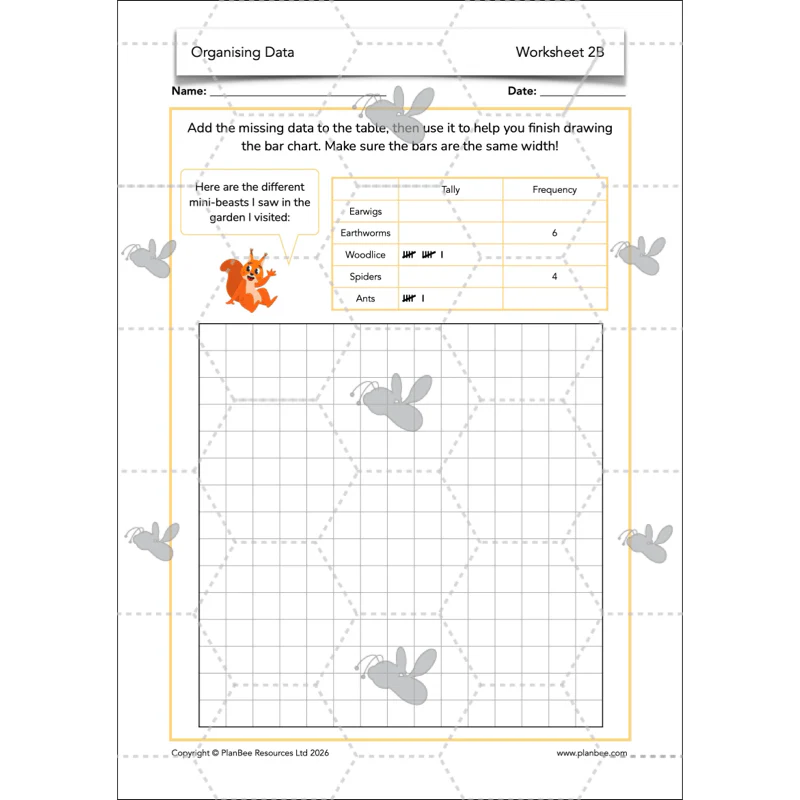
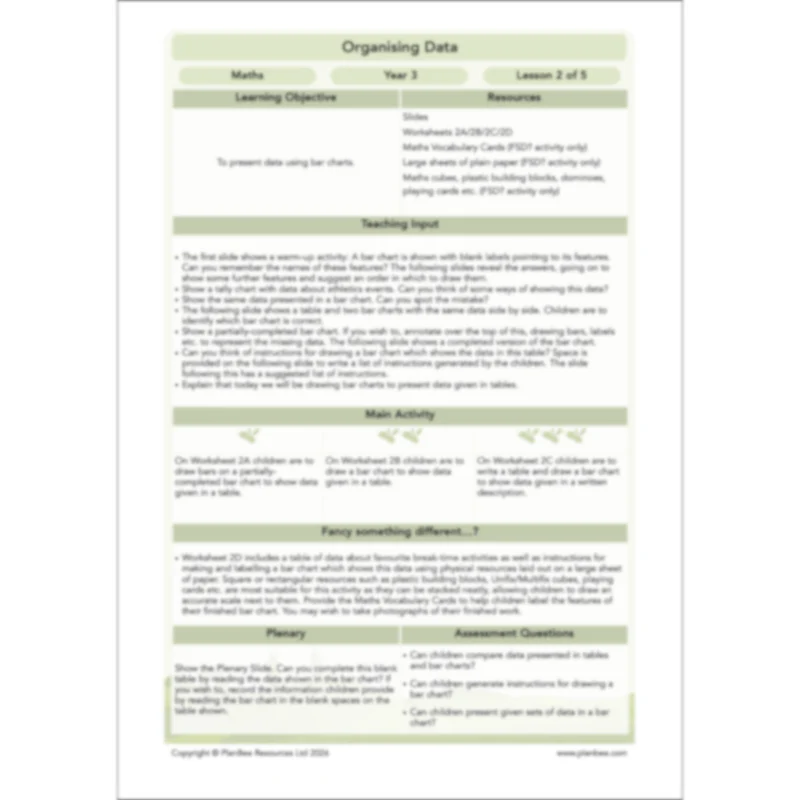
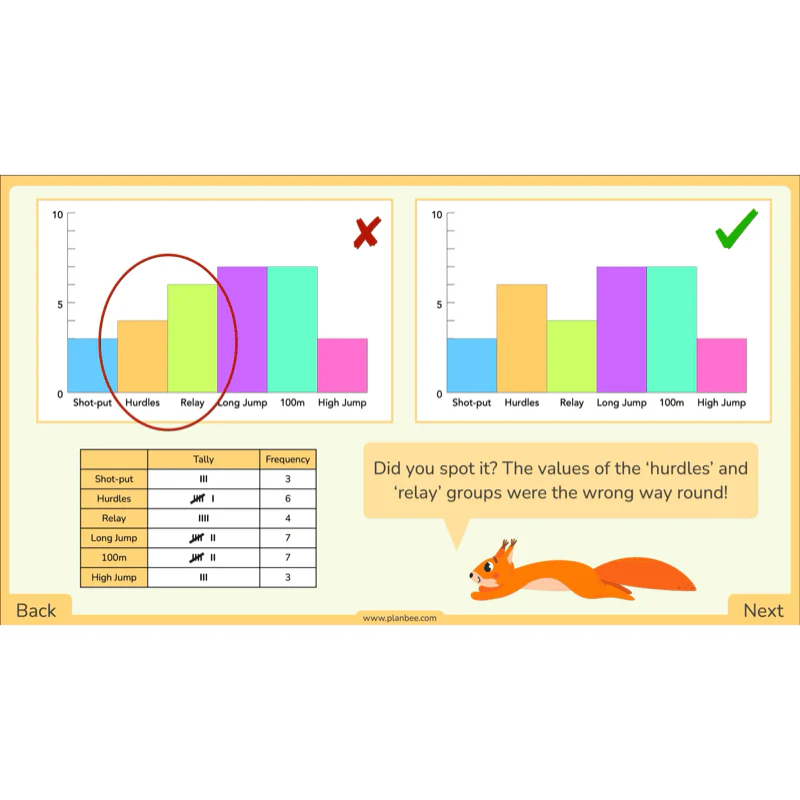
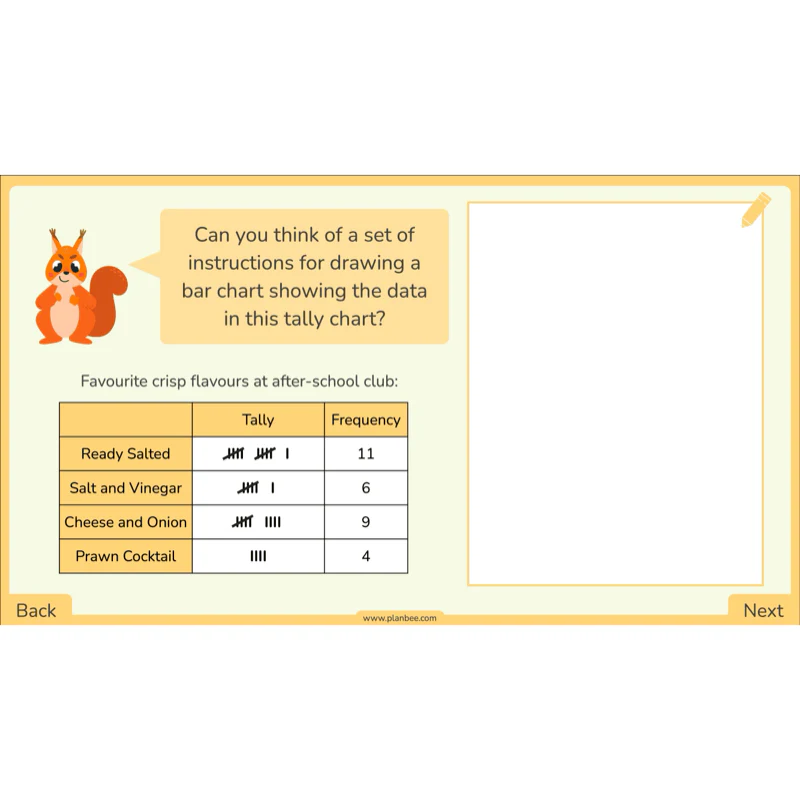
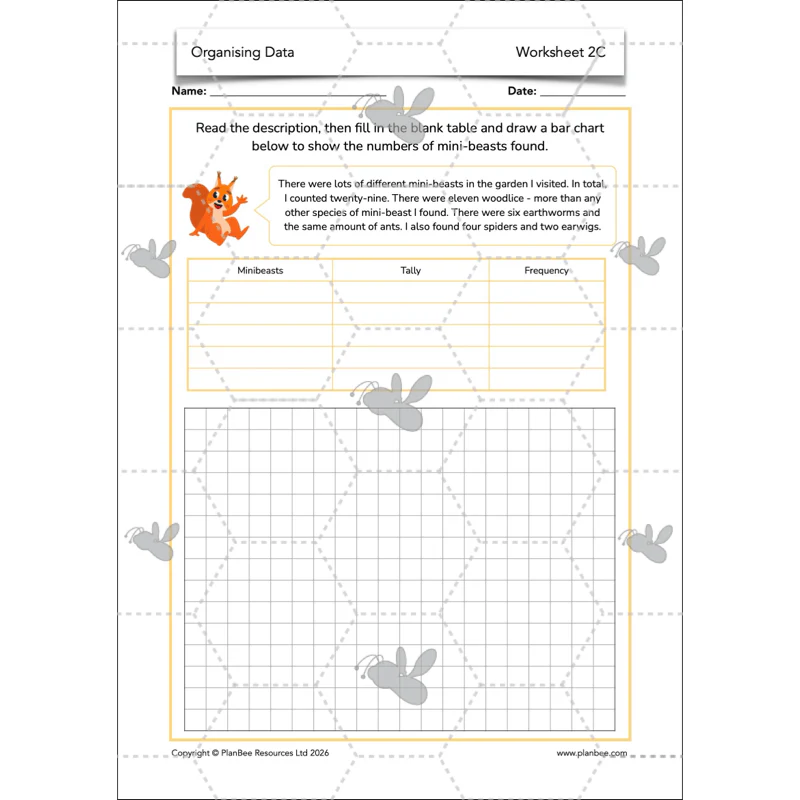
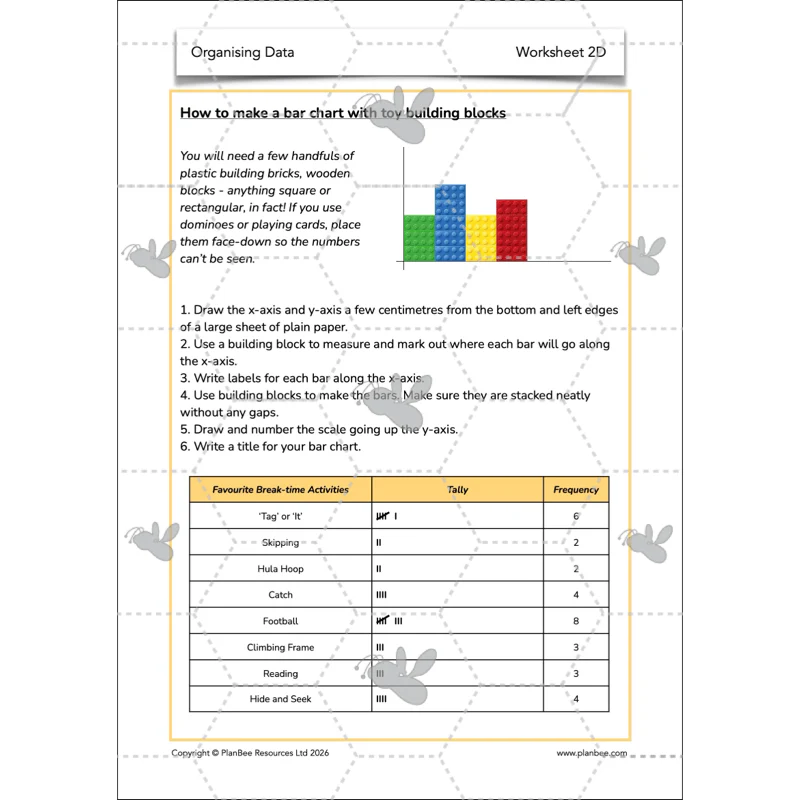
Get children engaged right away with a warm-up activity challenging them to think about the features of bar charts. Following this, the main focus of the lesson concerns presenting data collected in tables and tally charts. Explore ways of ensuring bar charts are drawn accurately, going on to think about how data in tables can be checked using bar charts and vice-versa. Whichever of the two activities you choose for your class, children will be challenged to make accurate bar charts using the provided sets of data.
This downloadable lesson includes a lesson plan, slideshow presentation and printable teaching resources.
What's included:
- Lesson plan
- Slides
- Activity ideas
- Differentiated worksheets
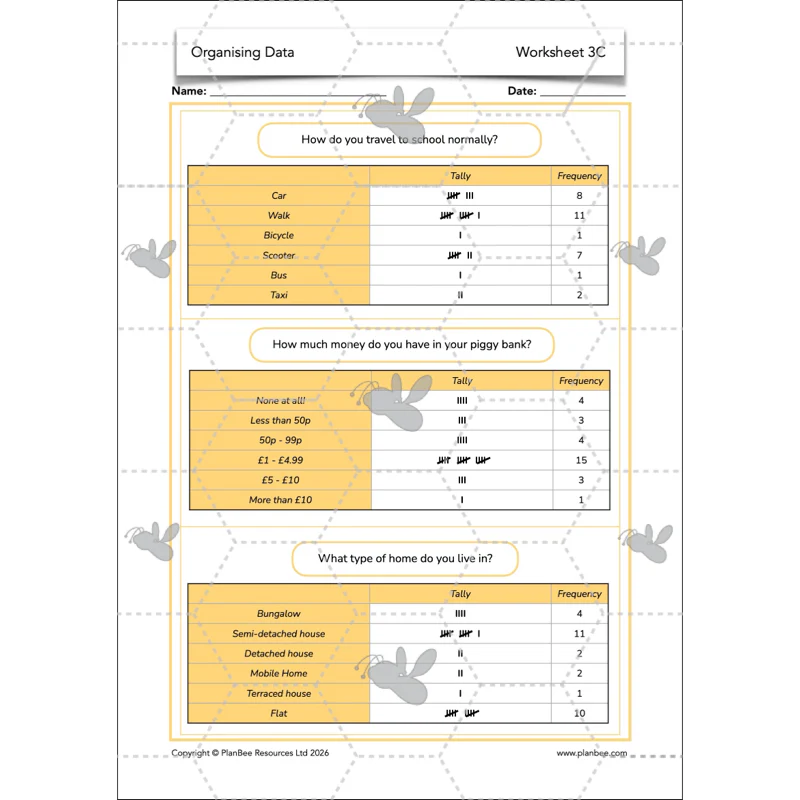
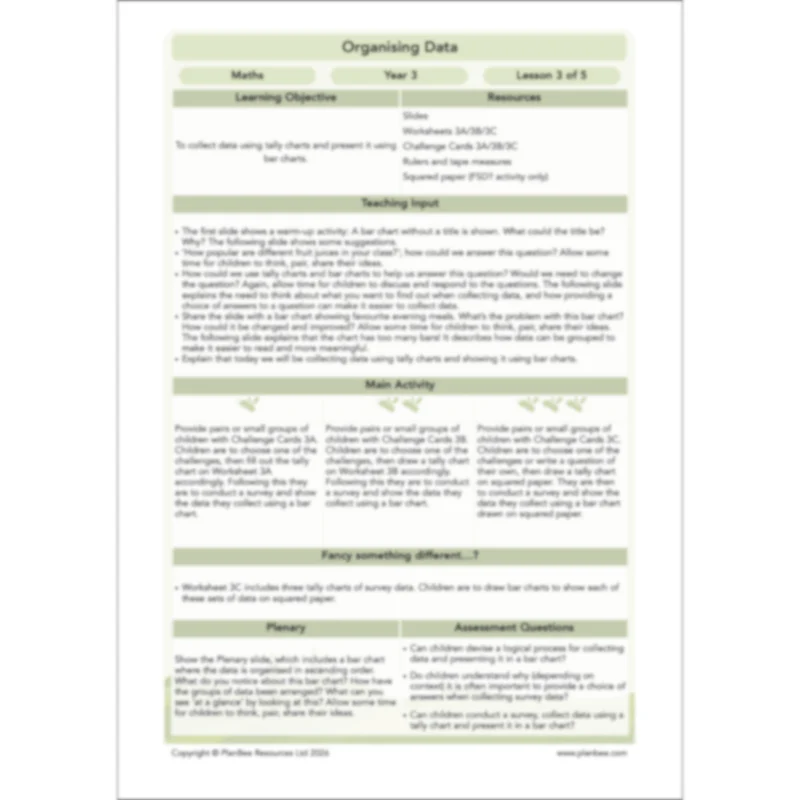
Collecting data
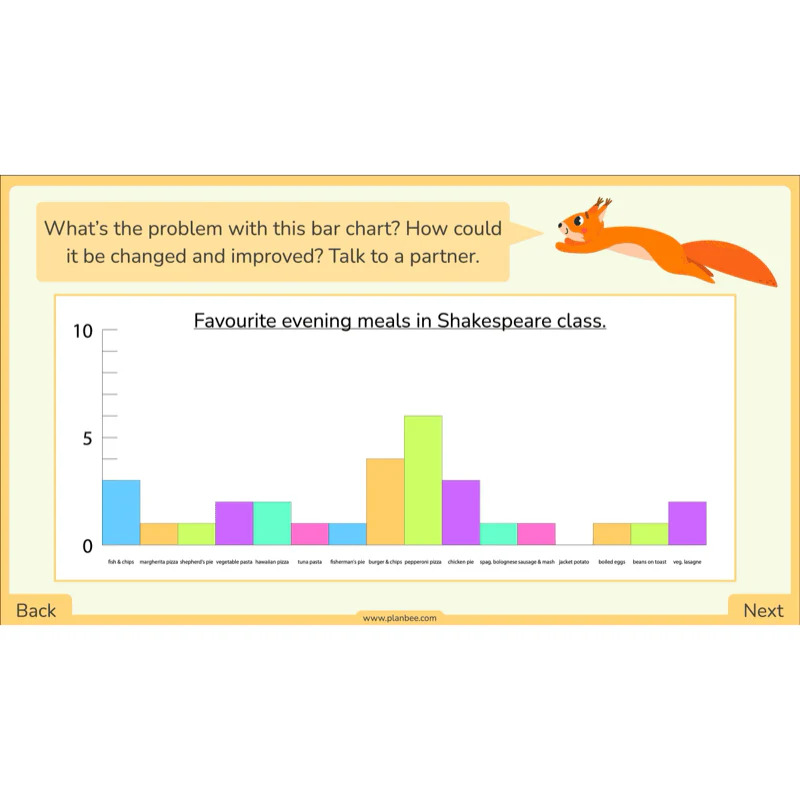
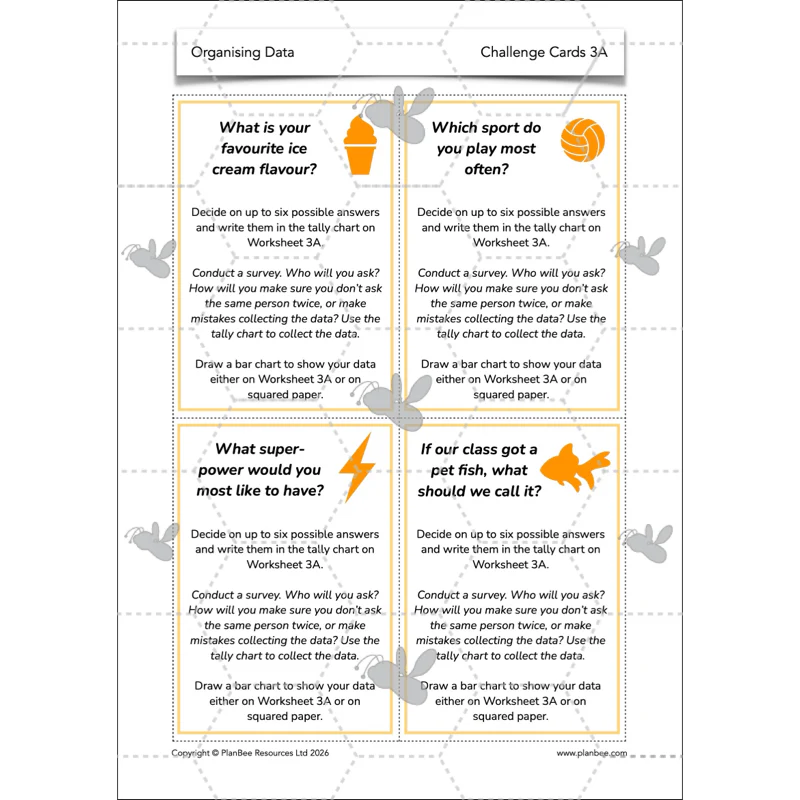
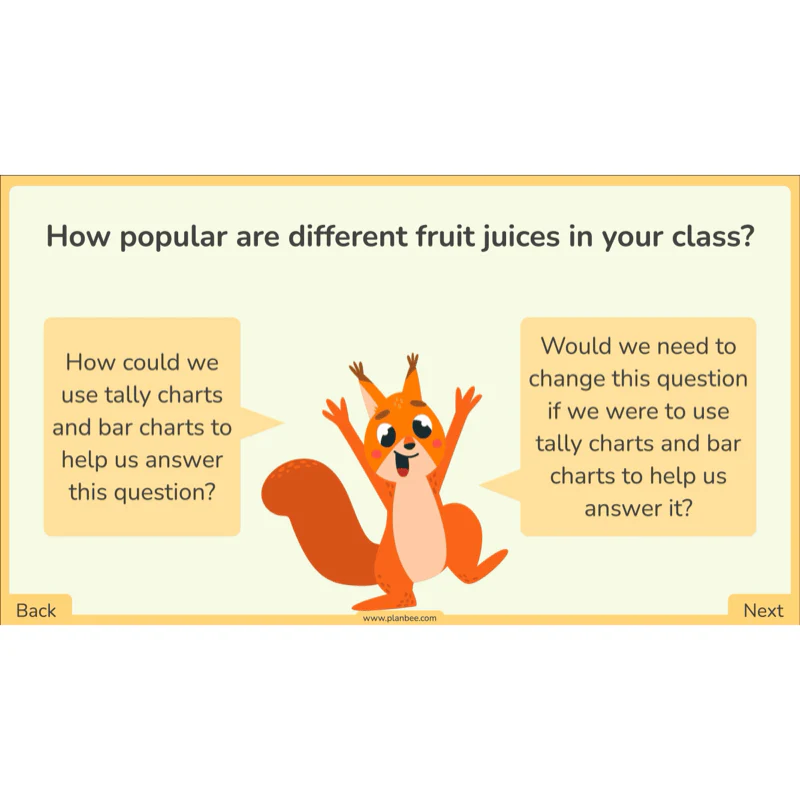
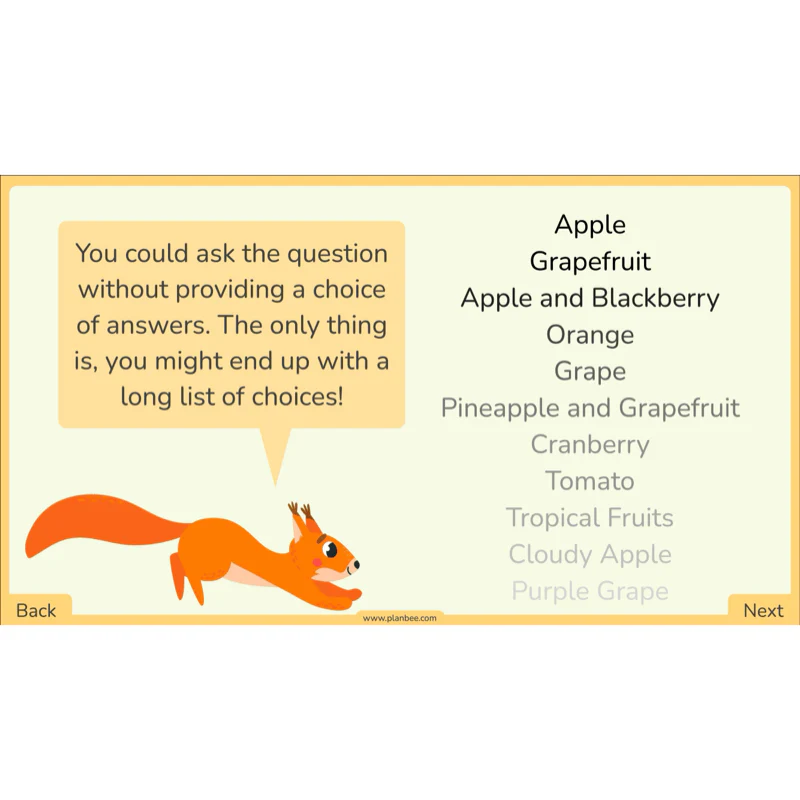
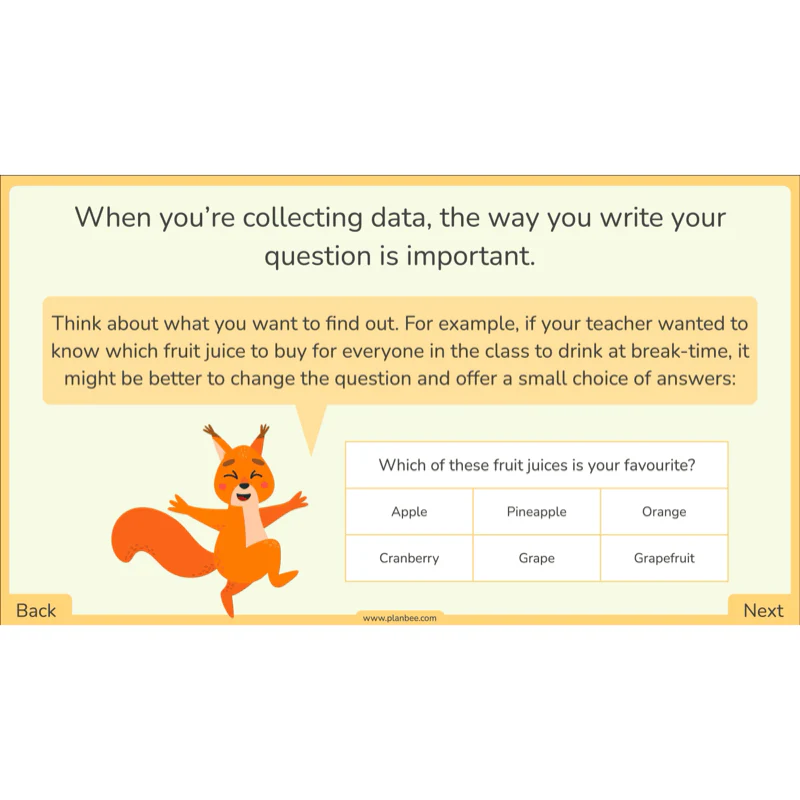
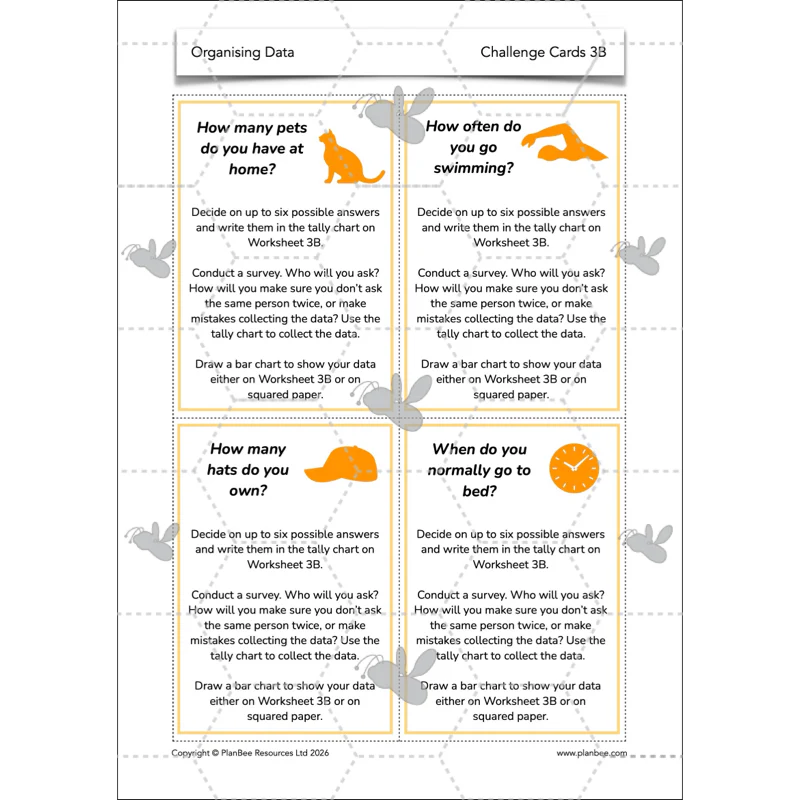
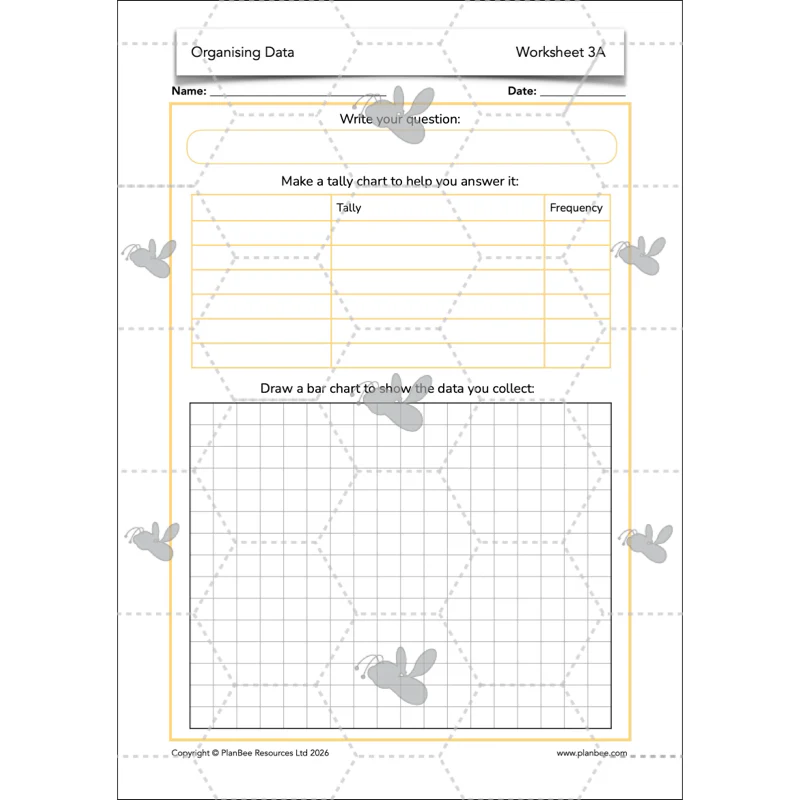
The degree of challenge increases now that children are more familiar with bar charts: use the detailed slides to help children consider what makes a good/bad question when conducting a survey. The detailed graphics clearly show some common problems and misconceptions that can arise when children make bar charts. Following this, whichever of the two activities you choose give children the chance to plan and conduct their own survey and show the data they collect using a bar chart.
This downloadable lesson includes a lesson plan, slideshow presentation and printable teaching resources.
What's included:
- Lesson plan
- Slides
- Activity ideas
- Differentiated challenge cards
- Differentiated worksheets
- Squared paper
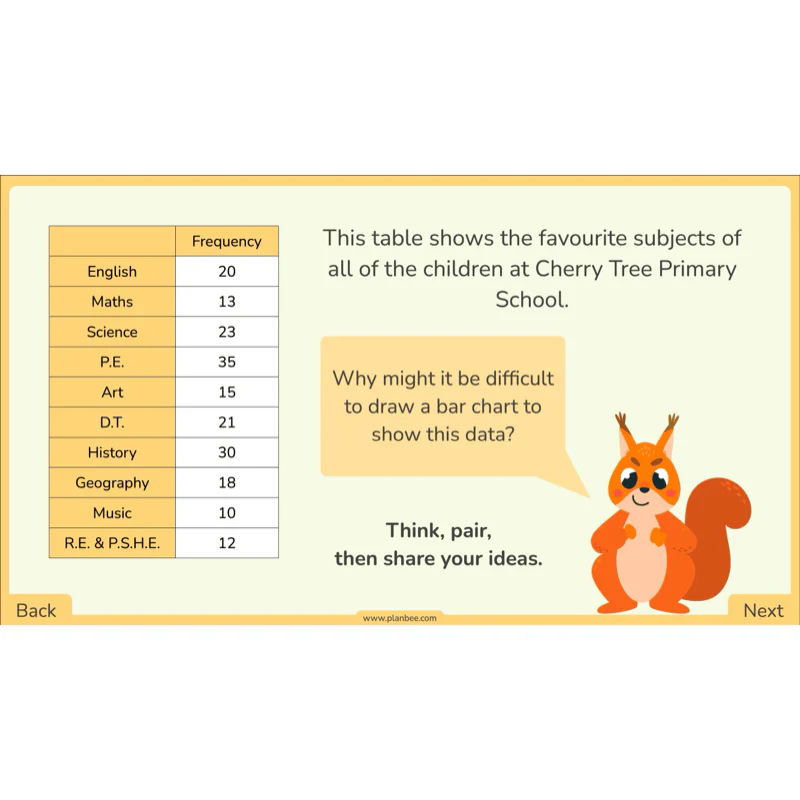
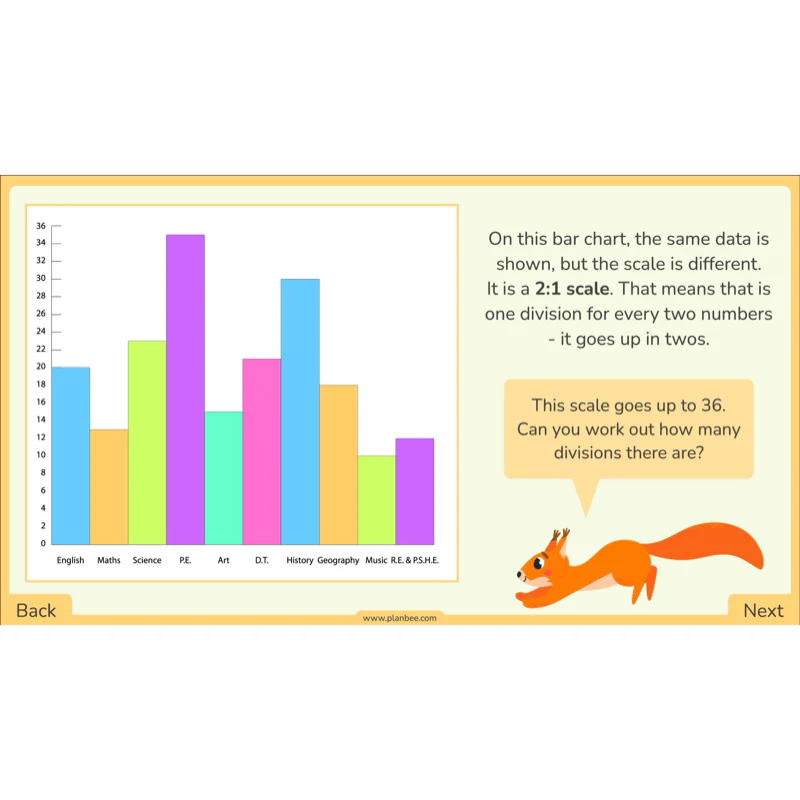
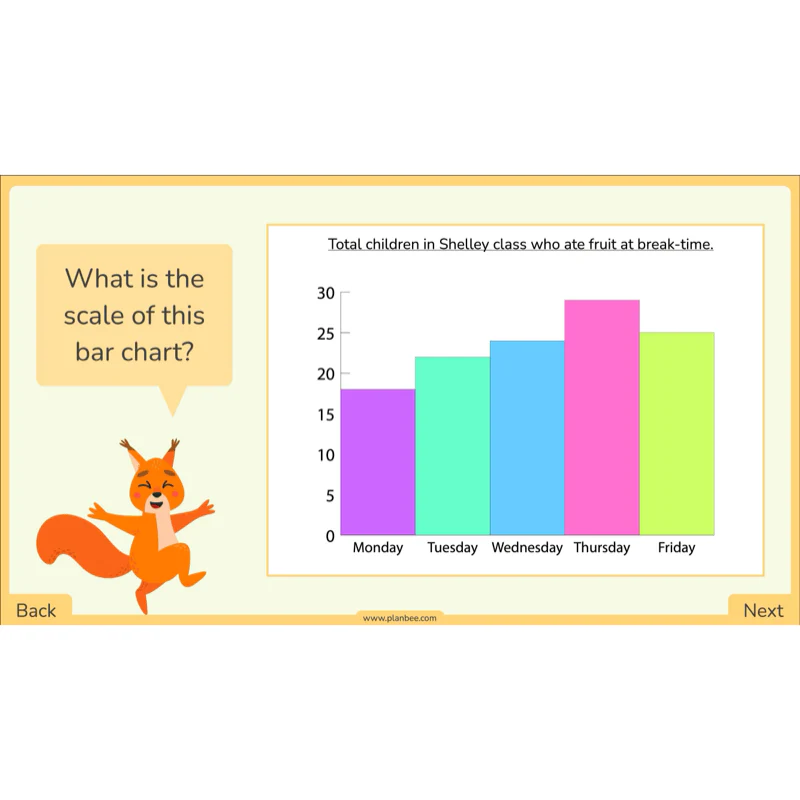
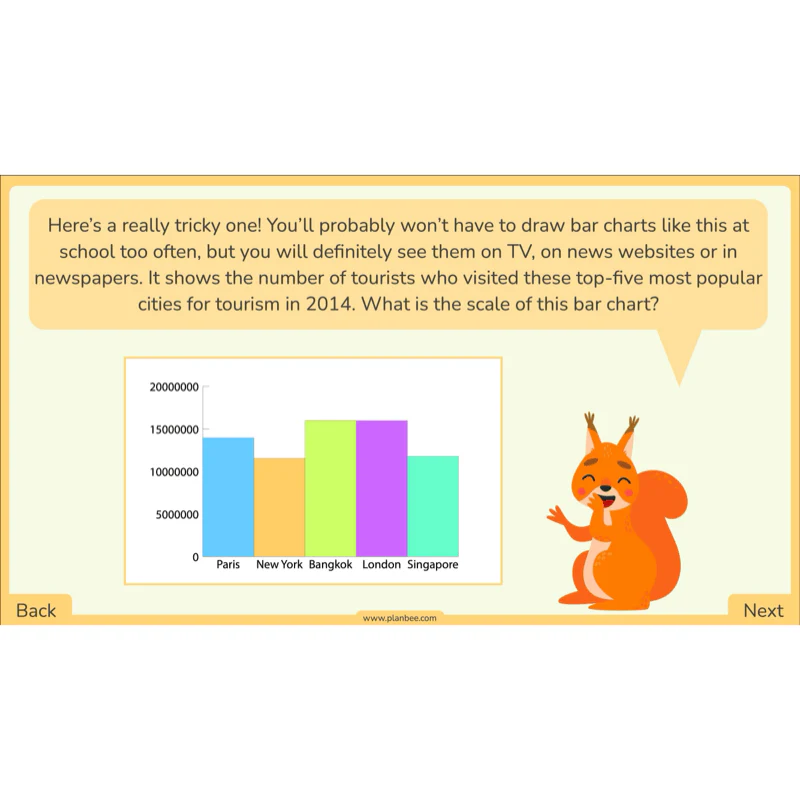
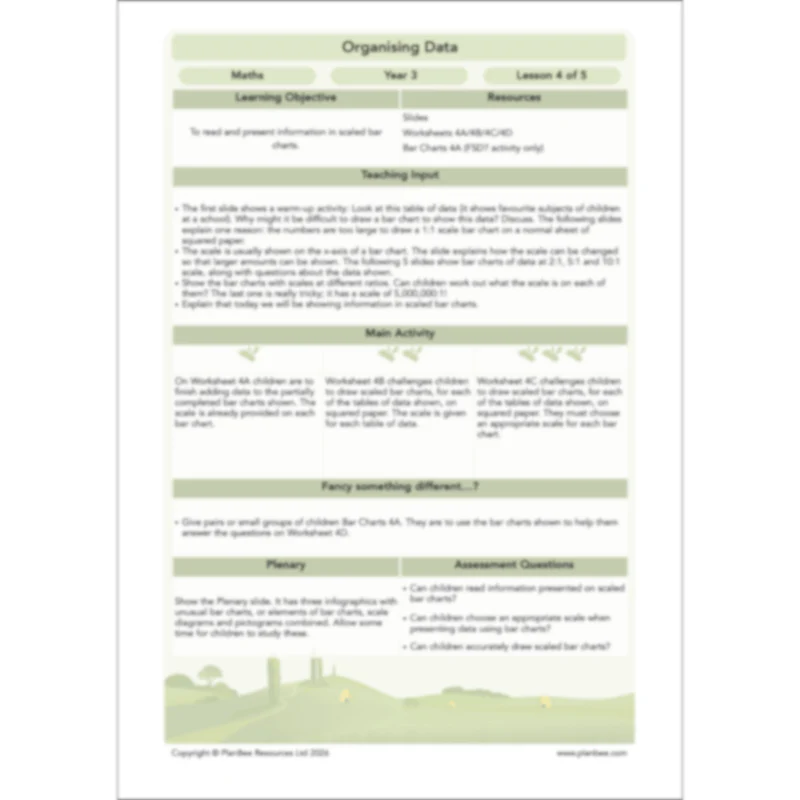
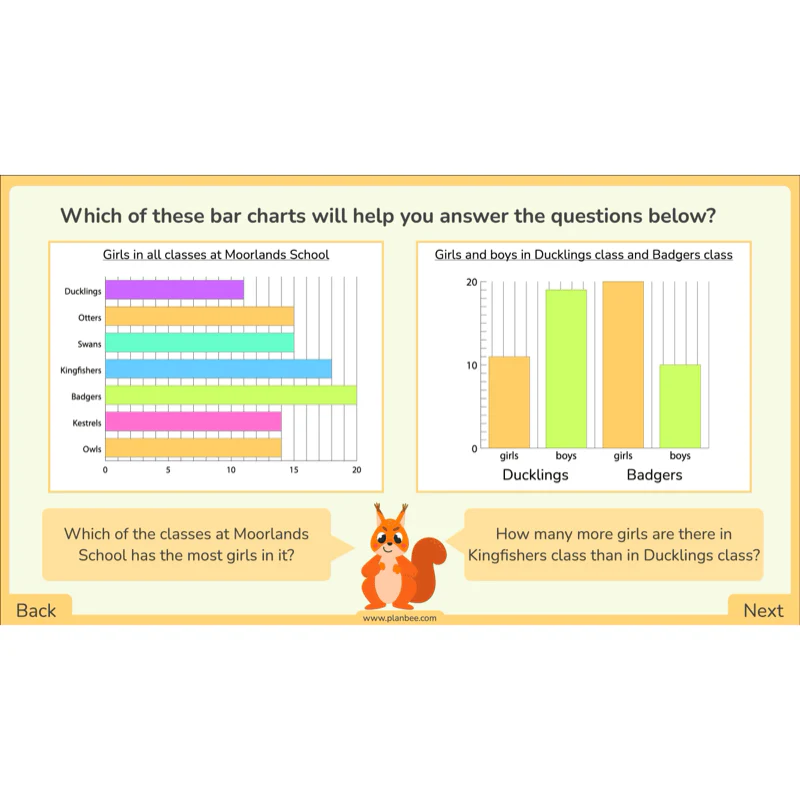
Scaled bar charts
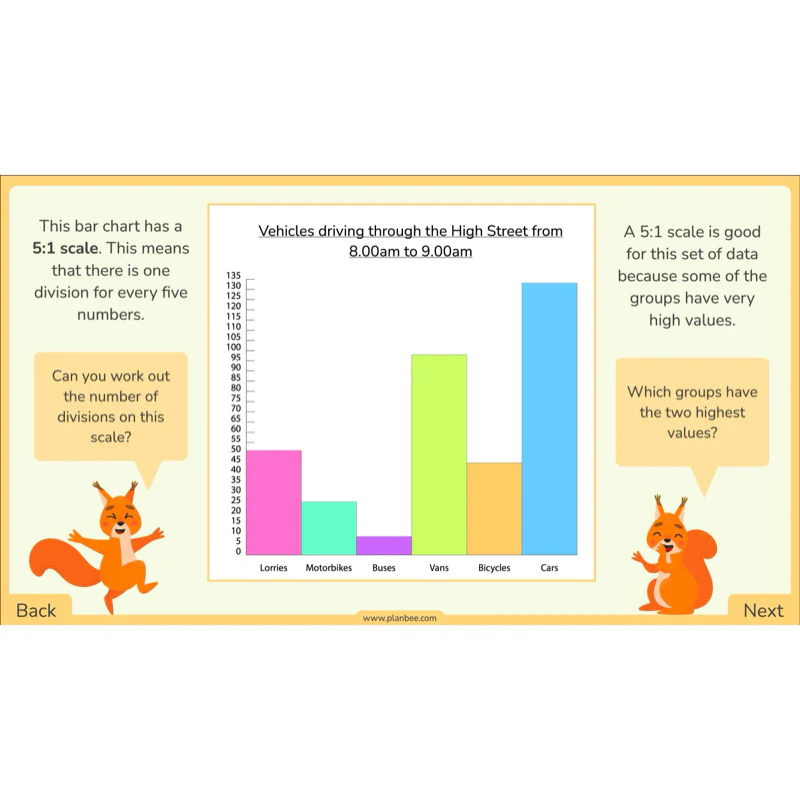
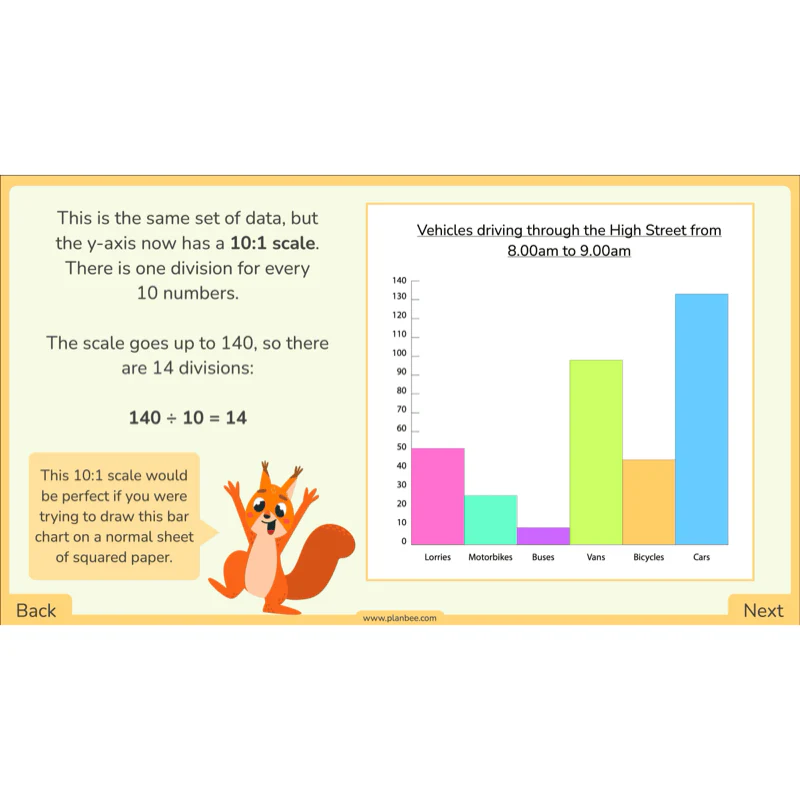
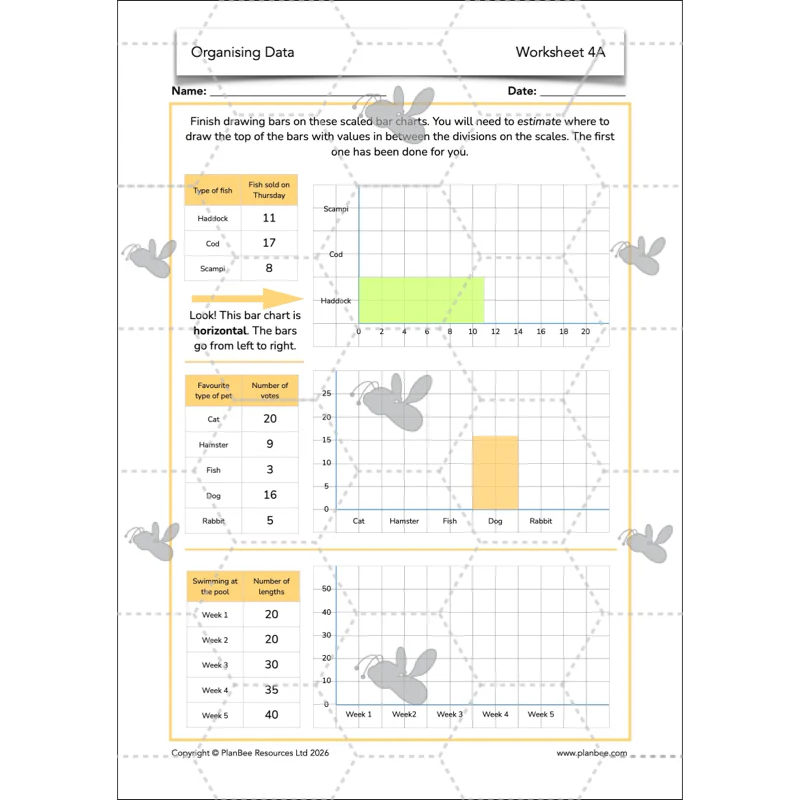
It can be pretty challenging to explain mathematical concepts in ways that are meaningful for children, but the detailed graphics on the slides, included with this lesson, will help your class understand why it is useful to be able to present data in bar charts using different scales. There are several examples of data sets requiring bar charts at different scales for children to study, as well as clear, straightforward explanations of how to draw bar charts at 2:1, 5:1 and 10:1 scales.
This downloadable lesson includes a lesson plan, slideshow presentation and printable teaching resources.
What's included:
- Lesson plan
- Slides
- Activity ideas Differentiated worksheets
- Bar charts
- Squared paper
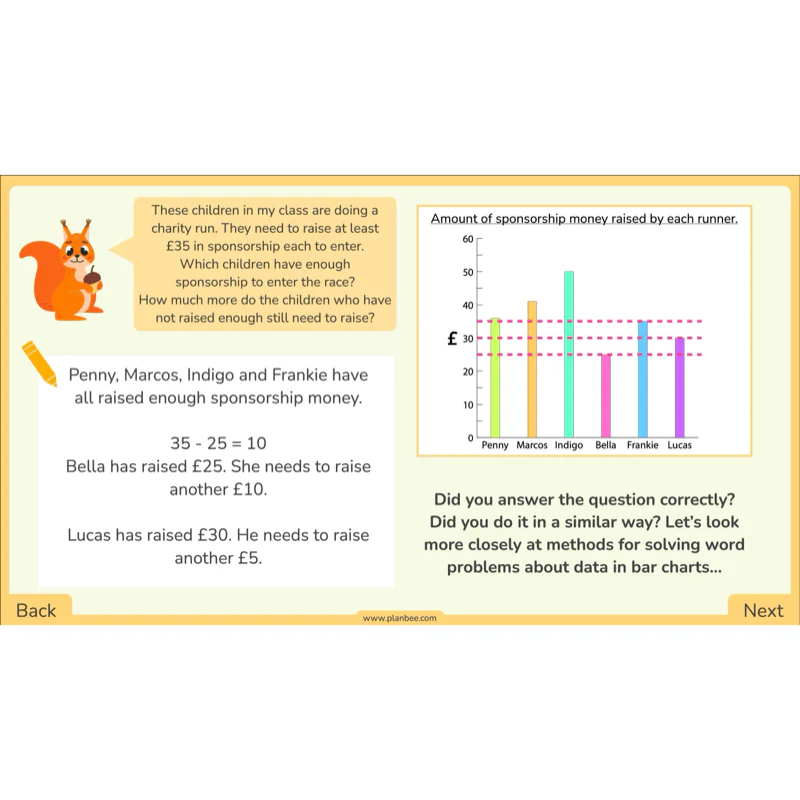
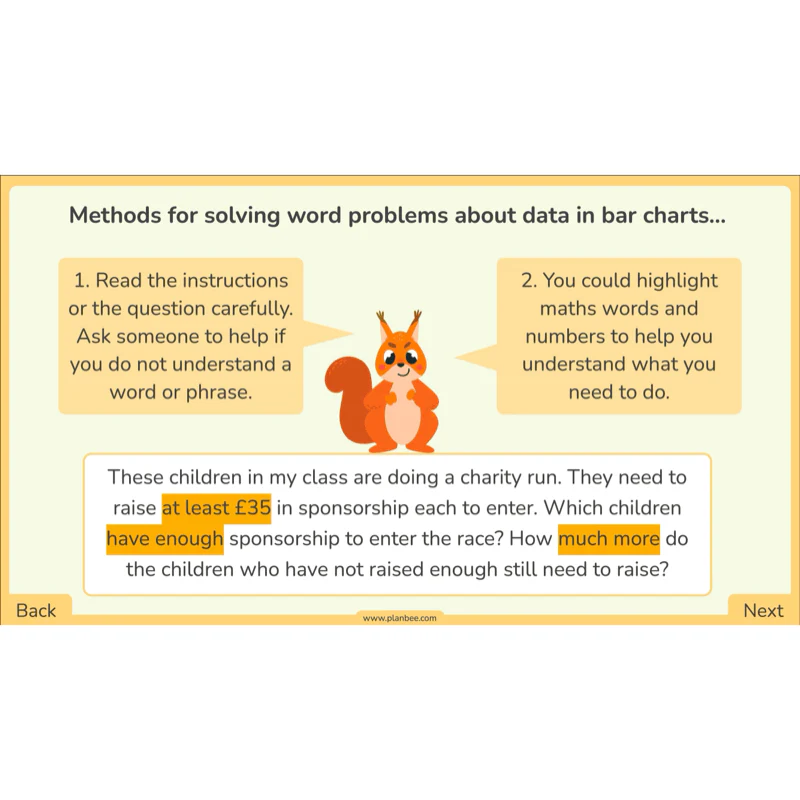
Solve problems with bar charts
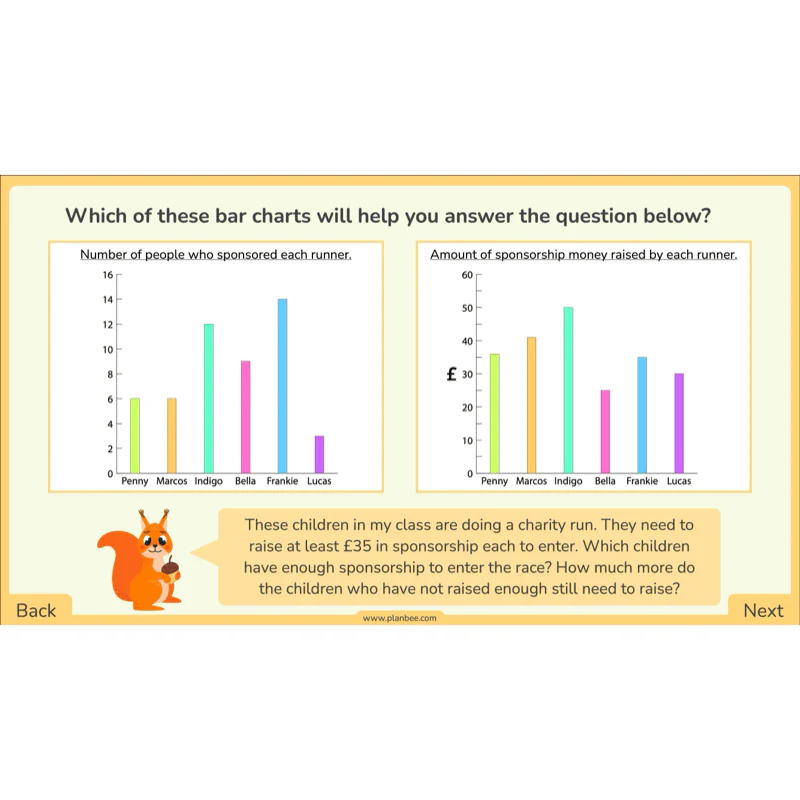
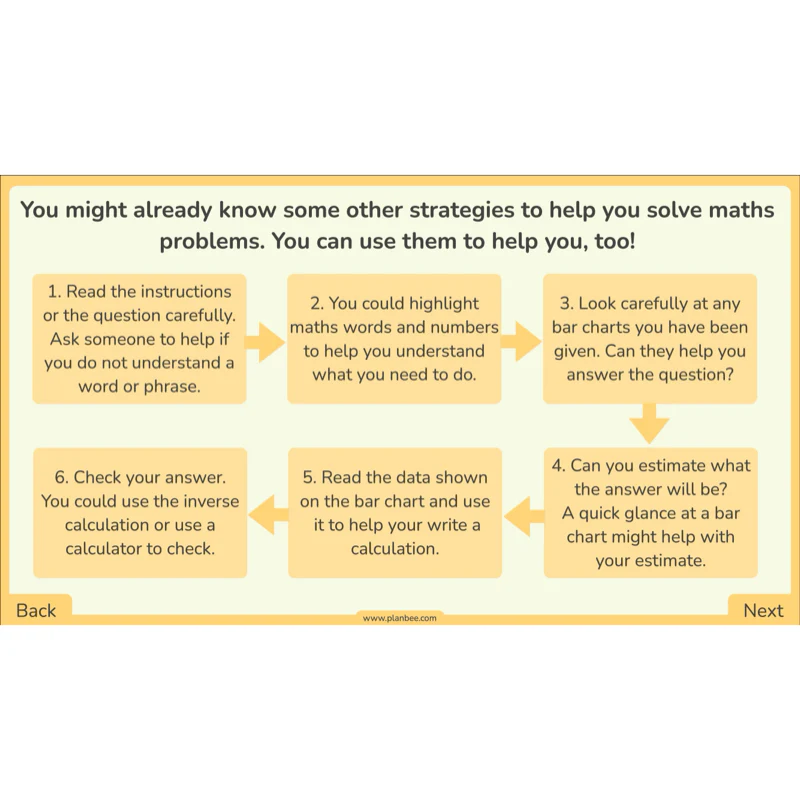
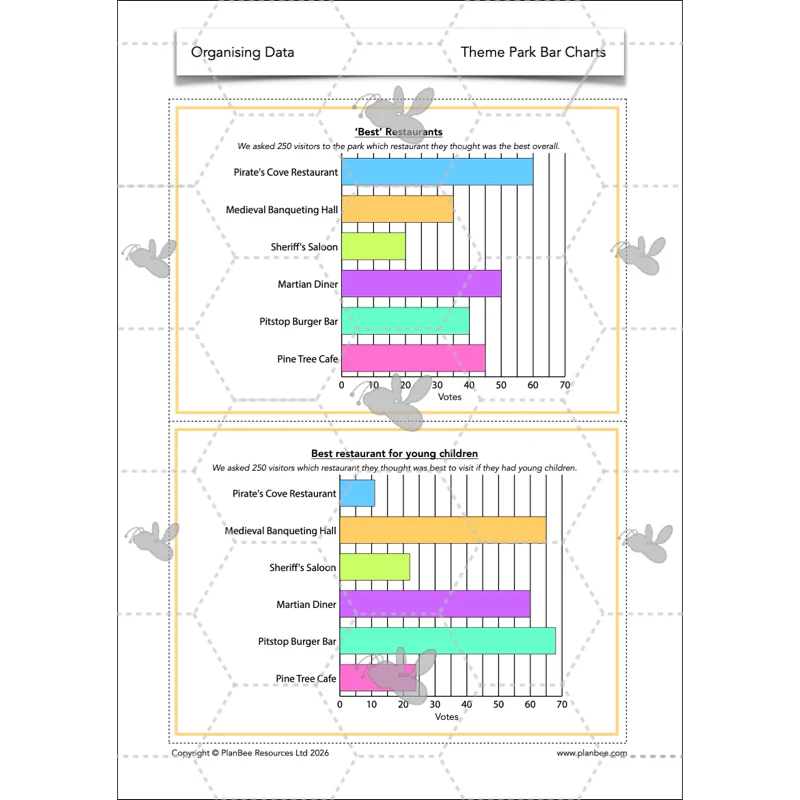
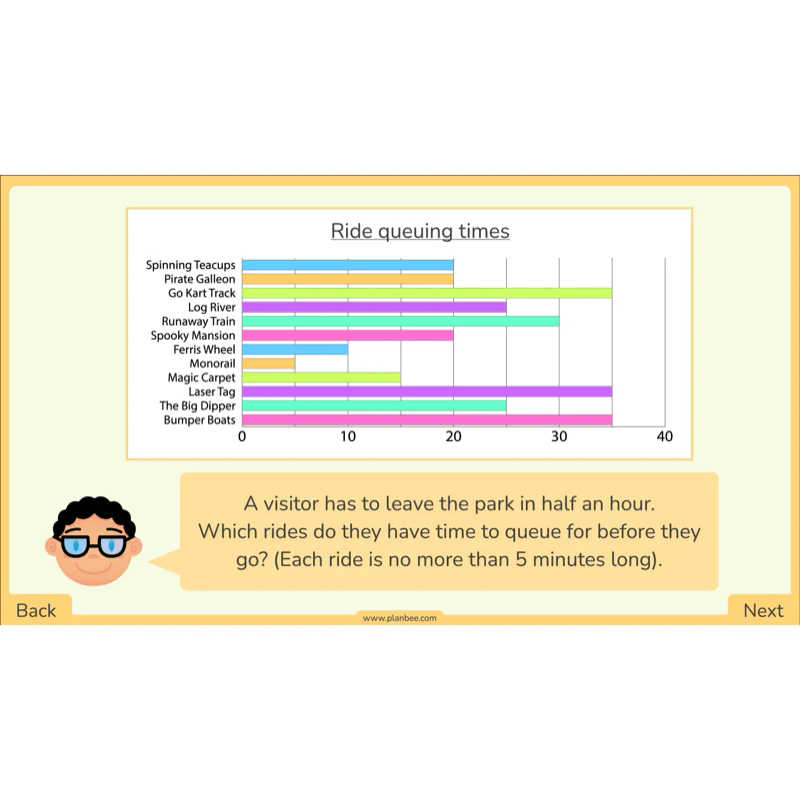
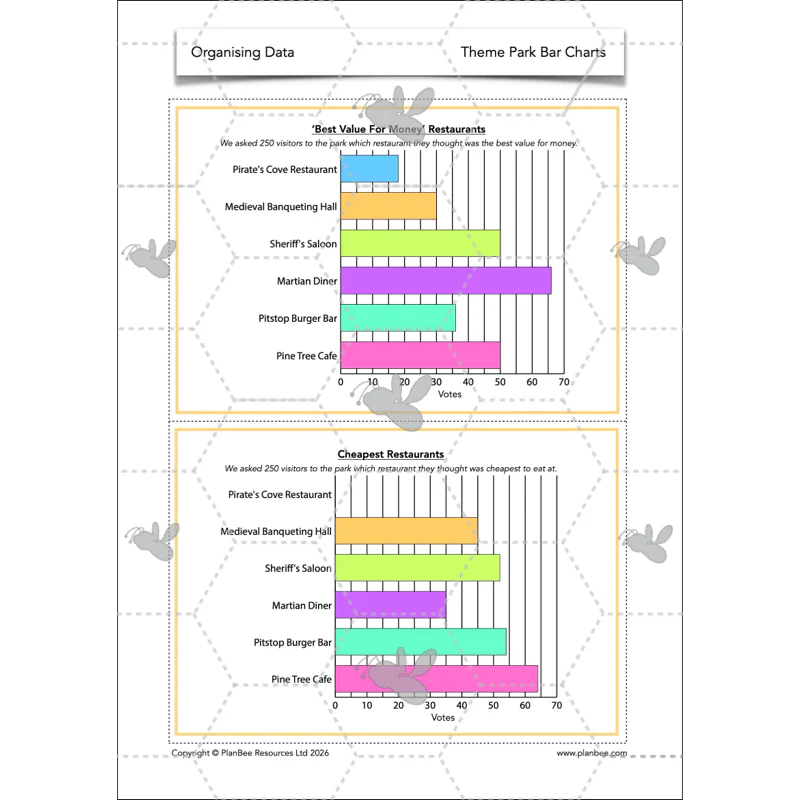
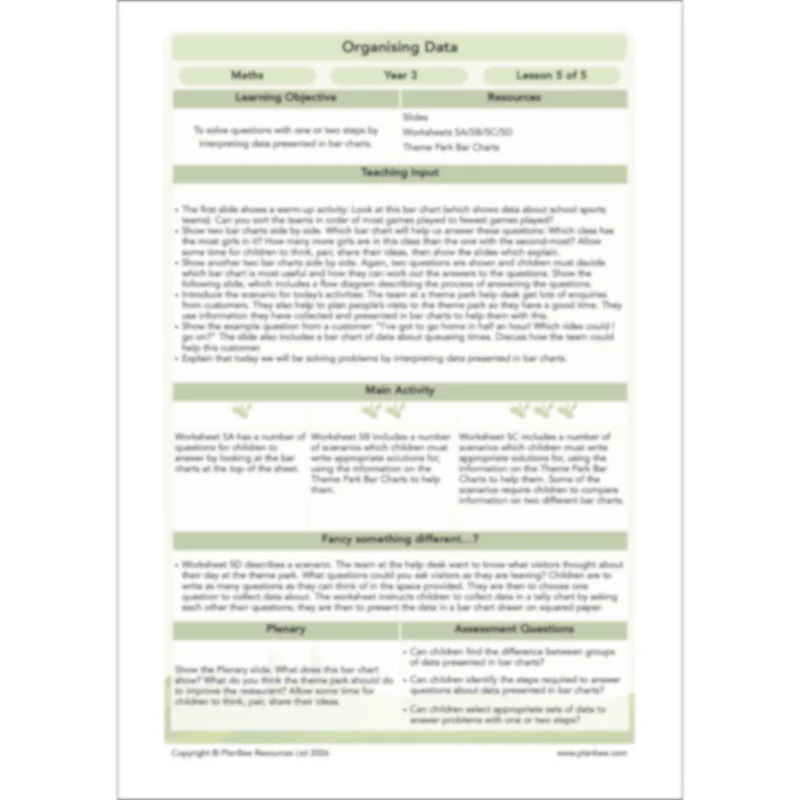
What do we actually use bar charts for? The realistic examples described in the slides for this lesson help children consider this, going on to explain a step-by-step strategy for unpicking word problems that can be answered using bar charts. Whichever of the two activities you choose to do with your class, children will be challenged to put what they have learned throughout the week into practice, during either one of the amusement park-themed challenges.
This downloadable lesson includes a lesson plan, slideshow presentation and printable teaching resources.
What's included:
- Lesson plan
- Slides
- Activity ideas
- Differentiated worksheets
- Squared paper
- Theme park bar charts
Original: $3.49
-70%$3.49
$1.05More Images


Organising Data
Explore how to capture, present and interpret data using tally charts and bar charts in this series of five lessons for Year 3 children. Teaching 7-8 year-olds how to read and draw bar charts accurately can be tricky! We've put these plans, slides, worksheets and other printable resources together to help make teaching these tricky maths skills a little bit easier. The resources will help children progress from using simple tables and pictograms to using increasingly complex bar charts with groups/ranges of data at different scales. Each lesson comes with a choice of activities so you can choose the ideal learning journey for your children.
Each lesson includes a detailed plan, an informative set of slides for the teaching input, and differentiated worksheets.
Start using bar charts
Kick-start the week's maths learning by recapping ways of presenting data which children may already be familiar with, such as straightforward tables, pictograms and block diagrams. Moving on, the slides show the features of bar charts and how data can be presented in them. Following this there's a choice of activities, either of which will encourage children to start using bar charts as well as using mathematical vocabulary to describe them.
This downloadable lesson includes a lesson plan, slideshow presentation and printable teaching resources.
What's included:
- Lesson plan
- Slides
- Activity ideas
- Differentiated worksheets
- Maths vocabulary cards
Presenting data
Get children engaged right away with a warm-up activity challenging them to think about the features of bar charts. Following this, the main focus of the lesson concerns presenting data collected in tables and tally charts. Explore ways of ensuring bar charts are drawn accurately, going on to think about how data in tables can be checked using bar charts and vice-versa. Whichever of the two activities you choose for your class, children will be challenged to make accurate bar charts using the provided sets of data.
This downloadable lesson includes a lesson plan, slideshow presentation and printable teaching resources.
What's included:
- Lesson plan
- Slides
- Activity ideas
- Differentiated worksheets
Collecting data
The degree of challenge increases now that children are more familiar with bar charts: use the detailed slides to help children consider what makes a good/bad question when conducting a survey. The detailed graphics clearly show some common problems and misconceptions that can arise when children make bar charts. Following this, whichever of the two activities you choose give children the chance to plan and conduct their own survey and show the data they collect using a bar chart.
This downloadable lesson includes a lesson plan, slideshow presentation and printable teaching resources.
What's included:
- Lesson plan
- Slides
- Activity ideas
- Differentiated challenge cards
- Differentiated worksheets
- Squared paper
Scaled bar charts
It can be pretty challenging to explain mathematical concepts in ways that are meaningful for children, but the detailed graphics on the slides, included with this lesson, will help your class understand why it is useful to be able to present data in bar charts using different scales. There are several examples of data sets requiring bar charts at different scales for children to study, as well as clear, straightforward explanations of how to draw bar charts at 2:1, 5:1 and 10:1 scales.
This downloadable lesson includes a lesson plan, slideshow presentation and printable teaching resources.
What's included:
- Lesson plan
- Slides
- Activity ideas Differentiated worksheets
- Bar charts
- Squared paper
Solve problems with bar charts
What do we actually use bar charts for? The realistic examples described in the slides for this lesson help children consider this, going on to explain a step-by-step strategy for unpicking word problems that can be answered using bar charts. Whichever of the two activities you choose to do with your class, children will be challenged to put what they have learned throughout the week into practice, during either one of the amusement park-themed challenges.
This downloadable lesson includes a lesson plan, slideshow presentation and printable teaching resources.
What's included:
- Lesson plan
- Slides
- Activity ideas
- Differentiated worksheets
- Squared paper
- Theme park bar charts
Product Information
Product Information
Shipping & Returns
Shipping & Returns
Description
Explore how to capture, present and interpret data using tally charts and bar charts in this series of five lessons for Year 3 children. Teaching 7-8 year-olds how to read and draw bar charts accurately can be tricky! We've put these plans, slides, worksheets and other printable resources together to help make teaching these tricky maths skills a little bit easier. The resources will help children progress from using simple tables and pictograms to using increasingly complex bar charts with groups/ranges of data at different scales. Each lesson comes with a choice of activities so you can choose the ideal learning journey for your children.
Each lesson includes a detailed plan, an informative set of slides for the teaching input, and differentiated worksheets.
Start using bar charts
Kick-start the week's maths learning by recapping ways of presenting data which children may already be familiar with, such as straightforward tables, pictograms and block diagrams. Moving on, the slides show the features of bar charts and how data can be presented in them. Following this there's a choice of activities, either of which will encourage children to start using bar charts as well as using mathematical vocabulary to describe them.
This downloadable lesson includes a lesson plan, slideshow presentation and printable teaching resources.
What's included:
- Lesson plan
- Slides
- Activity ideas
- Differentiated worksheets
- Maths vocabulary cards
Presenting data
Get children engaged right away with a warm-up activity challenging them to think about the features of bar charts. Following this, the main focus of the lesson concerns presenting data collected in tables and tally charts. Explore ways of ensuring bar charts are drawn accurately, going on to think about how data in tables can be checked using bar charts and vice-versa. Whichever of the two activities you choose for your class, children will be challenged to make accurate bar charts using the provided sets of data.
This downloadable lesson includes a lesson plan, slideshow presentation and printable teaching resources.
What's included:
- Lesson plan
- Slides
- Activity ideas
- Differentiated worksheets
Collecting data
The degree of challenge increases now that children are more familiar with bar charts: use the detailed slides to help children consider what makes a good/bad question when conducting a survey. The detailed graphics clearly show some common problems and misconceptions that can arise when children make bar charts. Following this, whichever of the two activities you choose give children the chance to plan and conduct their own survey and show the data they collect using a bar chart.
This downloadable lesson includes a lesson plan, slideshow presentation and printable teaching resources.
What's included:
- Lesson plan
- Slides
- Activity ideas
- Differentiated challenge cards
- Differentiated worksheets
- Squared paper
Scaled bar charts
It can be pretty challenging to explain mathematical concepts in ways that are meaningful for children, but the detailed graphics on the slides, included with this lesson, will help your class understand why it is useful to be able to present data in bar charts using different scales. There are several examples of data sets requiring bar charts at different scales for children to study, as well as clear, straightforward explanations of how to draw bar charts at 2:1, 5:1 and 10:1 scales.
This downloadable lesson includes a lesson plan, slideshow presentation and printable teaching resources.
What's included:
- Lesson plan
- Slides
- Activity ideas Differentiated worksheets
- Bar charts
- Squared paper
Solve problems with bar charts
What do we actually use bar charts for? The realistic examples described in the slides for this lesson help children consider this, going on to explain a step-by-step strategy for unpicking word problems that can be answered using bar charts. Whichever of the two activities you choose to do with your class, children will be challenged to put what they have learned throughout the week into practice, during either one of the amusement park-themed challenges.
This downloadable lesson includes a lesson plan, slideshow presentation and printable teaching resources.
What's included:
- Lesson plan
- Slides
- Activity ideas
- Differentiated worksheets
- Squared paper
- Theme park bar charts